


 11 / 39

D
A
B
B
D
C
C
Hrz 4900
Hrz 5500
Hrz 6100
A
Noa East
Noa East
Noa East
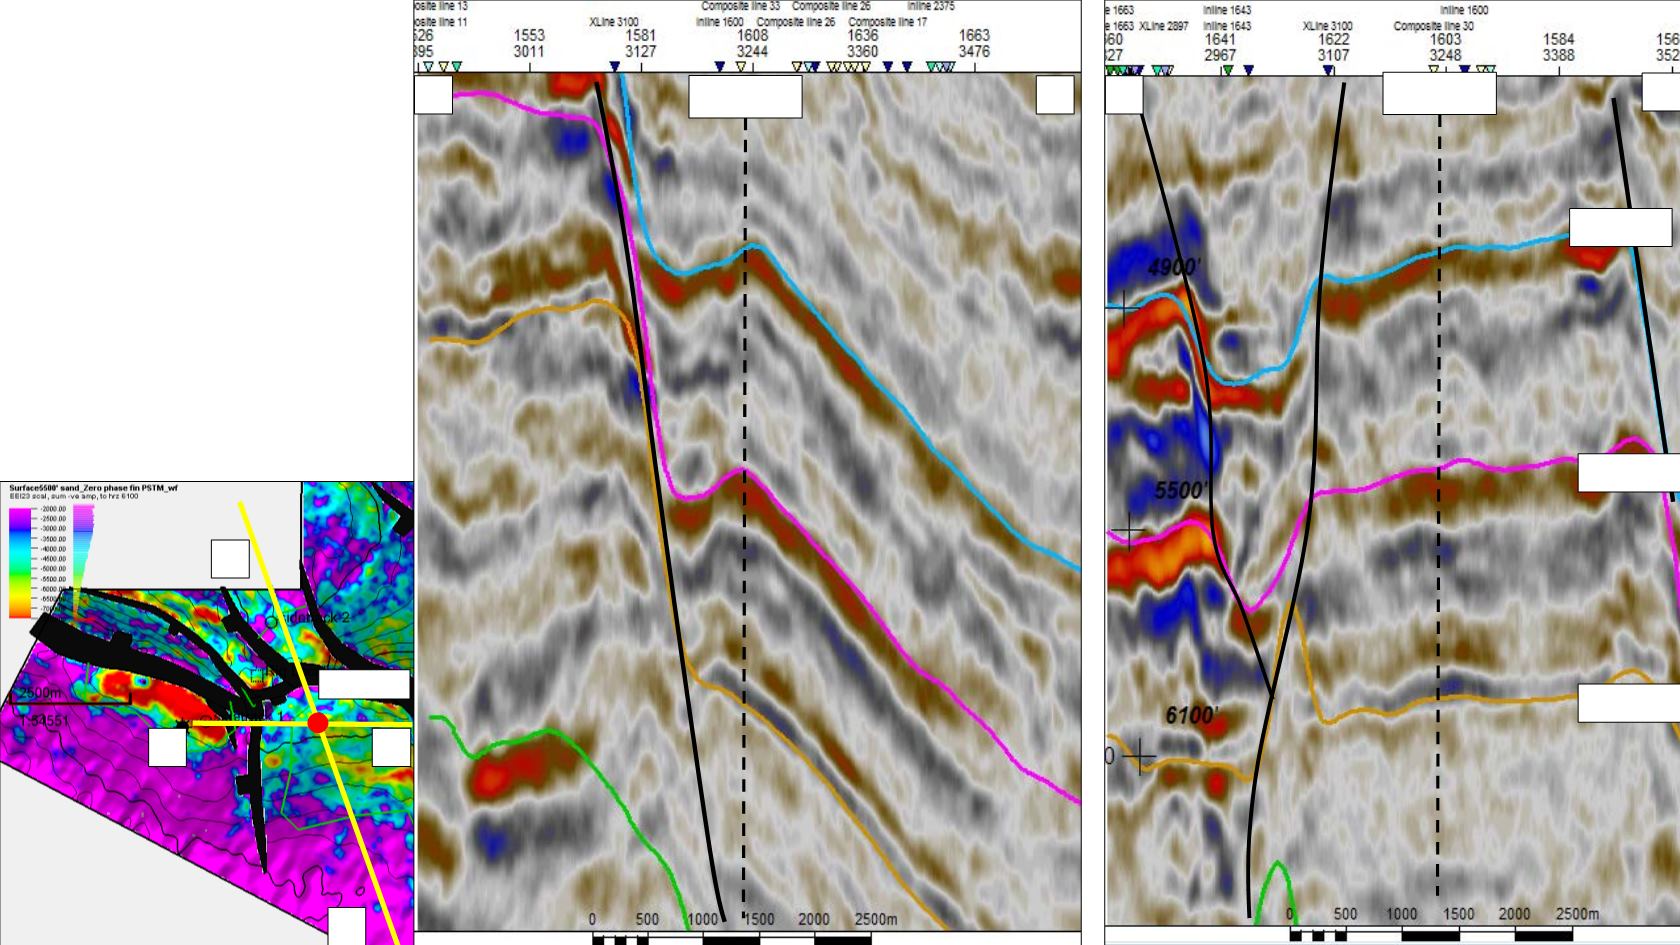
EEI23 data
Warm colour
amplitudes indicative
of hydrocarbons
both on map and
section.
Location of lines as
indicated on map.
Proposed location of Noa
East well