


 46 / 56

© 2012 AOAC INTERNATIONAL
G
UIDELINES
FOR
S
TANDARD
M
ETHOD
P
ERFORMANCE
R
EQUIREMENTS
AOAC O
FFICIAL
M
ETHODS
OF
A
NALYSIS
(2012)
Appendix F, p. 12
ANNEX C
Understanding the POD Model
Excerpted from AOAC INTERNATIONAL Methods Committee
Guidelines for Validation of Biological Threat Agent Methods
and/or Procedures, J. AOAC Int.
94
, 1359(2011) and Official
Methods of Analysis of AOAC INTERNATIONAL (2012) 19th Ed.,
Appendix I.
The Probability of Detection (POD) model is a way of
characterizing the performance of a qualitative (binary) method.
A binary qualitative method is one that gives a result as one of two
possible outcomes, either positive or negative, presence/absence,
or +/–.
The single parameter of interest is the POD, which is defined
as the probability at a given concentration of obtaining a positive
response by the detection method. POD is assumed to be dependent
on concentration, and generally, the probability of a positive
response will increase as concentration increases.
For example, at very low concentration, the expectation is that
the method will not be sensitive to the analyte, and at very high
concentration, a high probability of obtaining a positive response
is desired. The goal of method validation is to characterize how
method response transitions from low concentration/low response
to high concentration/high response.
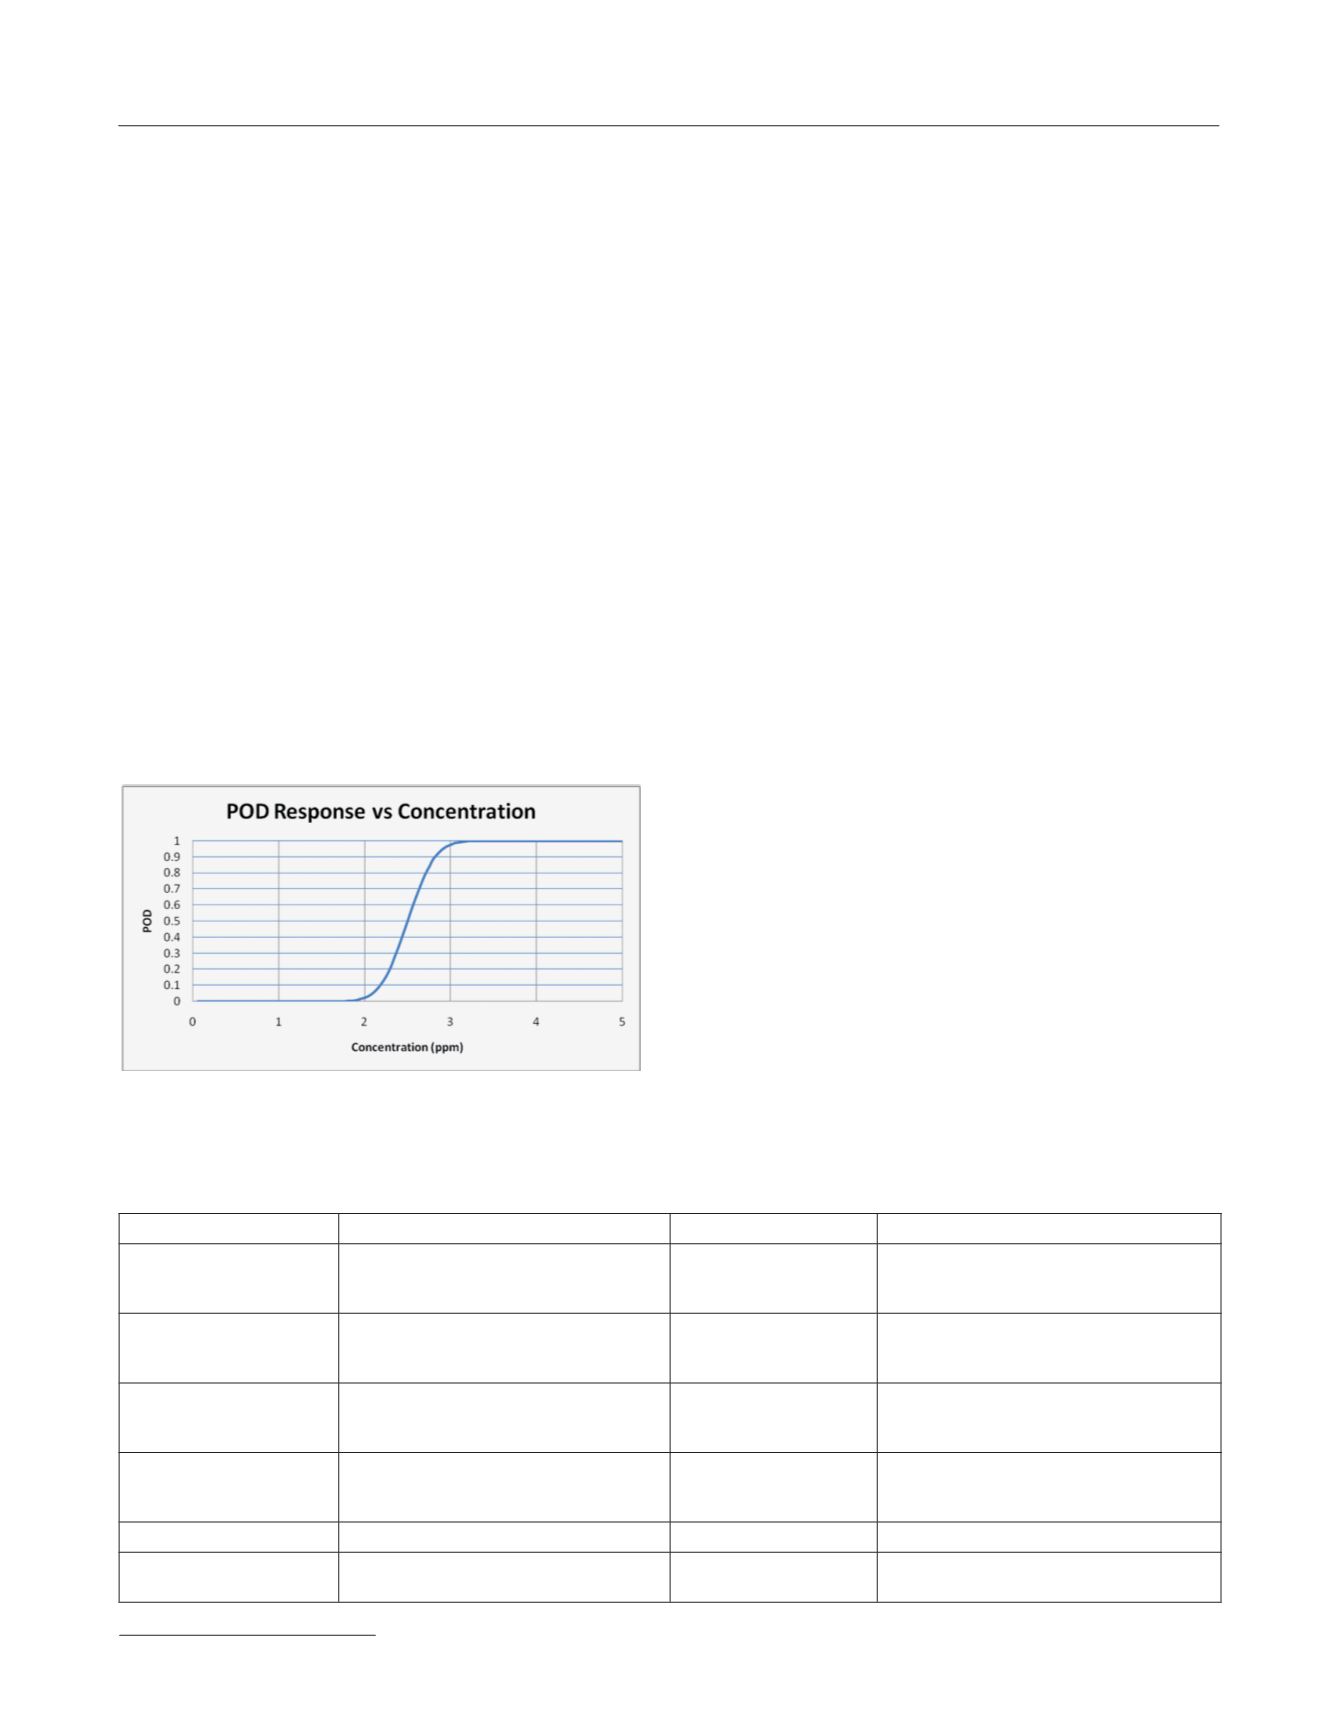
POD is always considered to be dependent upon analyte
concentration. The POD curve is a graphical representation of
method performance, where the probability is plotted as a function
of concentration (
see
, for example, Figure C1).
The POD model is designed to allow an objective description of
method response without consideration to an a priori expectation
of the probabilities at given concentrations. The model is general
enough to allow comparisons to any theoretical probability
function.
The POD model is also designed to allow for an independent
description of method response without consideration to the
response of a reference method. The model is general enough to
allow for comparisons between reference and candidate method
responses, if desired.
Older validation models have used the terms “sensitivity,”
“specificity,” “false positive,” and “false negative” to describe
method performance. The POD model incorporates all of the
performance concepts of these systems into a single parameter,
POD.
For example, false positive has been defined by some models
as the probability of a positive response, given the sample is truly
negative (concentration = 0). The equivalent point on the POD
curve for this performance characteristic is the value of the curve
at Conc = 0.
Similarly, false negative has sometimes been defined as the
probability of a negative response when the sample is truly positive
(concentration >0). In the POD curve, this would always be specific
to a given sample concentration, but would be represented as the
distance from the POD curve to the POD = 1 horizontal top axis at
all concentrations except C = 0.
The POD model incorporates all these method characteristics
into a single parameter, which is always assumed to vary by
concentration. In other models, the terms “false positive,” “false
negative,” “sensitivity,” and “specificity” have been defined in a
variety of ways, usually not conditional on concentration. For these
reasons, these terms are obsolete under this model (
see
Table C1).
The terms “sensitivity,” “specificity,” “false positive,” and “false
negative” are obsolete under the POD model (
see
Figure C2).
Table C1. Terminology
Traditional terminology
Concept
POD equivalent
Comment
False positive
Probability of the method giving a (+)
response when the sample is truly without
analyte
POD(0)
POD at conc = 0
POD curve value at conc = 0;
“
Y
-intercept” of the POD curve
Specificity
Probability of the method giving a (-)
response when the sample is truly without
analyte
1-POD(0)
Distance along the POD axis from POD = 1
to the POD curve value
False negative
(at a given
concentration)
Probability of a (–) response at a given
concentration
1-POD(c)
Distance from the POD curve to the POD =
1 “top axis” in the vertical direction
Sensitivity
(at a given
concentration)
Probability of a (+) response at a given
concentration
POD(c)
Value of the POD curve at any given
concentration
True negative
A sample that contains no analyte
C = 0
Point on concentration axis where c = 0
True positive
A sample that contains analyte at some
positive concentration
C > 0
Range of concentration where c > 0
Figure C1. Theoretical POD curve for a qualitative
detection method.