15
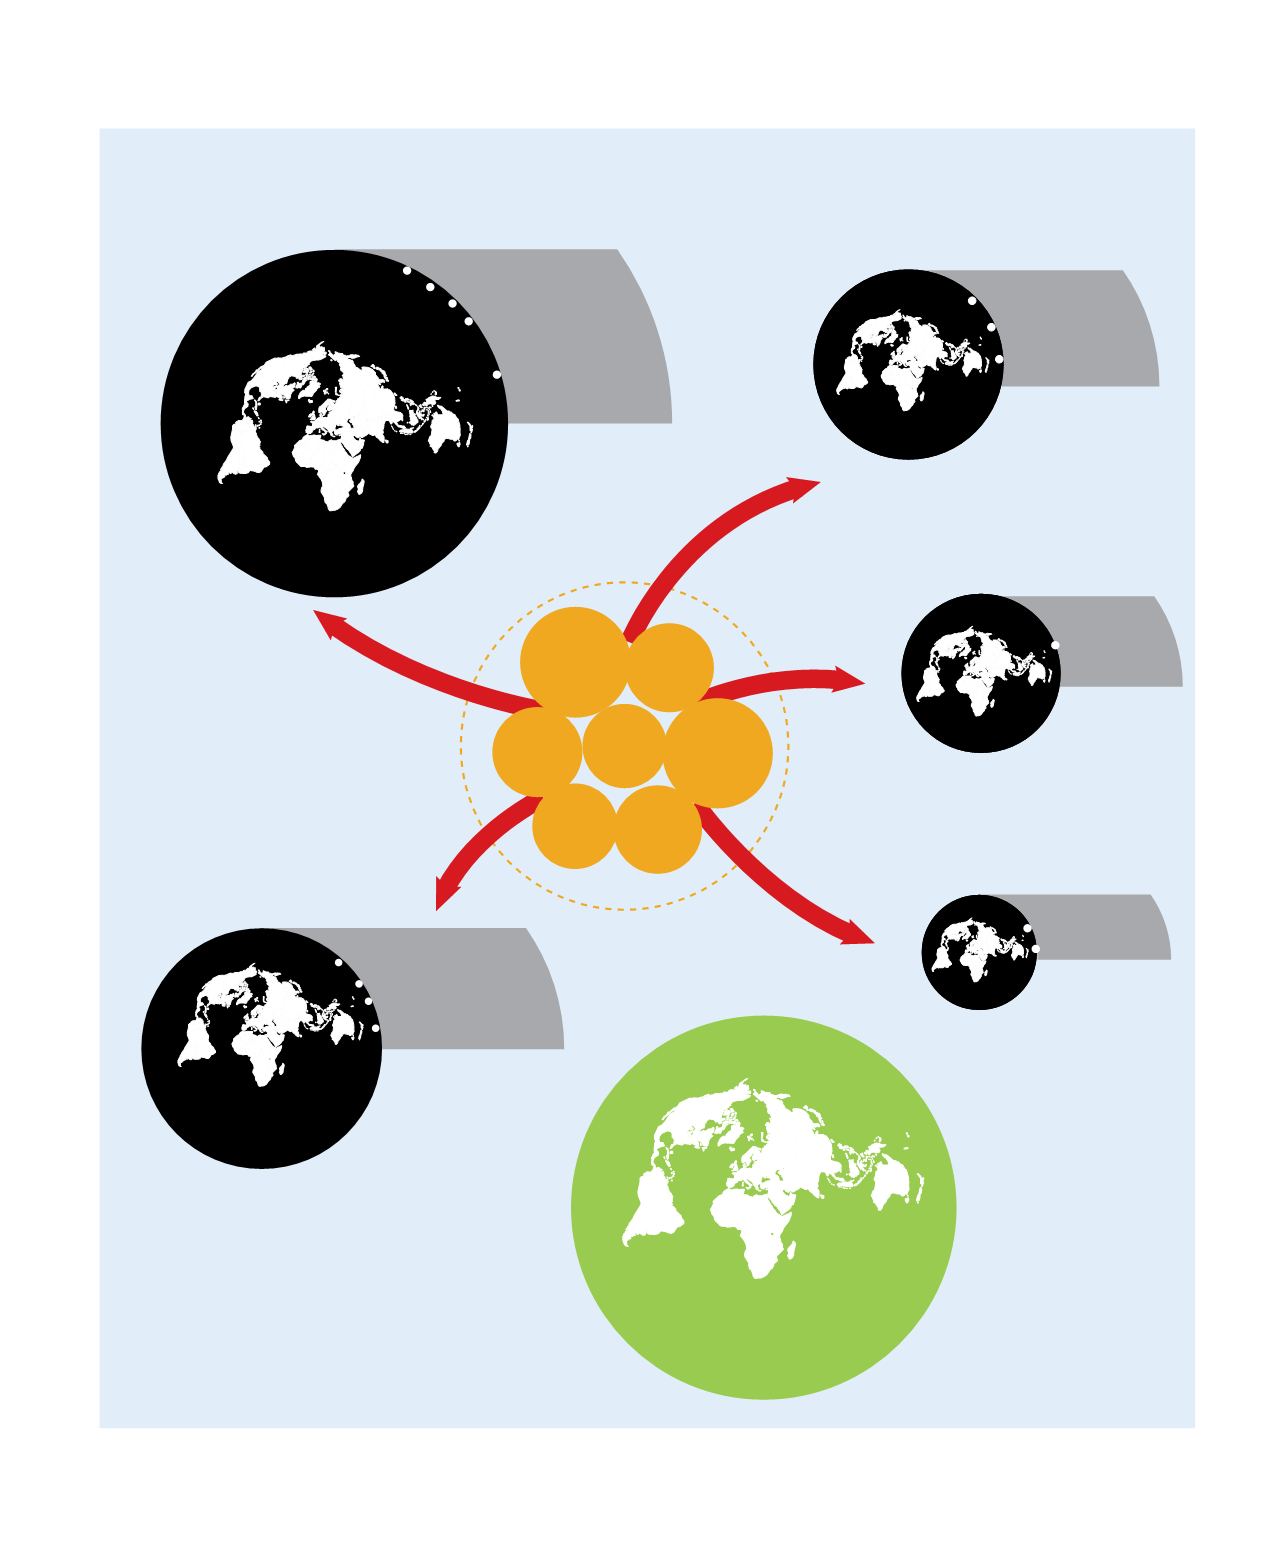
Figure 1.
Estimated scale of various forms of transnational environmental crime.
15
3
0
t
o
1
0
0
b
i
l
l
i
o
n
U
S
$
1
3
5
b
i
l
l
i
o
n
U
S
$
1
0
t
o
1
2
b
i
l
l
i
o
n
U
S
$
1
1
b
i
l
l
i
o
n
U
S
$
7
t
o
2
3
b
i
l
l
i
o
n
U
S
$
1
2
t
o
4
8
b
i
l
l
i
o
n
U
S
$
1
1
t
o
3
0
b
i
l
l
i
o
n
U
S
$
At stake:
At stake:
At stake:
At stake:
At stake:
A comparison:
Official Development
Assistance (ODA)
D
R
I
V
E
R
S
GRID-Arendal and Zoï Environment Network, 2012.
Resource depletion
Gold, diamond, rare earth...
Livelihoods (local communities)
Fish stocks depletion
Targeted species:
tuna, toothfish, sharks
Loss of revenues
for local fishers and States
Loss of raw material
for local industry
Livelihoods
Species extintion
Climate change emissions
from deforestation and forest
degradation
Species extinction
Endangered forests
Mafias
FISH
TIMBER
MINERALS
WILDLIFE
WASTE
Corporate
crime
Regional
Corruption
National
National
National
National
Local
Lack of
legislation
Increasing
demand
Domestic
International
International
International
National
National
International
Lack of law
enforcement
Conflict
Ecosystem depletion
Human health
Major routes from North
to South (unlike other
environmental crimes)
Tropical species
demand for pets,
food and traditional
medicine
Major environmental crimes
National economies:
Illegal logging between 15 and
30 % of the global legal trade


