


 153 / 218


z = 4
t > 1.28
2.8
2.7
2.9
3
3.2
3.6
4
3.2
3.6
4
anterior
posterior
t -value
Reward
Reward x
Task switch
Reward x Task switch x
Response switch
A
B
3
5
2
4
3.5
2.5
1.5
2
4
6
5
3
t -value
peak: x = 6, y = 16, z = 2
peak: x = -6, y = 6, z = -6 peak: x = -28, y = -8, z = 8
z = 8
z = 2
t > 3.14*
t > 2.61
y = 3
y = -8
t > 3.14*
y = 16
151
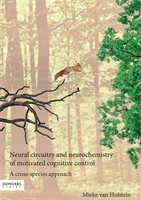
Controlling dorsolateral striatal function via anterior frontal cortex stimulation
Figure 7.5
Effect of aPFC stimulation (versus baseline) for Reward (red), the interaction
between Reward and Task switching (green), and between Reward, Task switching and
Response switching (blue)
A:
To visualize the gradients in the striatum, the whole-brain maps for these three contrasts are shown
in one image at a low threshold (t = 1.28, p < 0.1). We applied a filter over the image to visualize the
anterior-posterior and medial-lateral gradient in the striatum.
B:
Whole-brain maps at PUNC < 0.001, t > 3.14 (left and right) and at PUNC < 0.005, t > 2.61 (middle)
for Reward (left), Reward x Task switching (middle) and Reward x Task switching x Response switching
(right).
Asterisks (*) and black dashed circles indicate a significant effect of Reward (left) and the Reward x Task
switching x Response switching (right) (PFWE < 0.05 within the search volume, i.e. the caudate nucleus
or putamen, respectively) and red and blue dashed lines indicate the z-coordinates for the peaks of these
respective effects to visualize the ventral to dorsal gradient.