


 18 / 63


O
fitserova
& N
erkar
:
J
ournal of
AOAC I
nternational
V
ol
.
99, N
o
.
6, 2016
1475
Precision Results
Method precision was evaluated using the eight matrixes
discussed earlier. The chosen samples represented common
forms of green tea dietary ingredients and supplements and
were found to cover a wide range of
l
-theanine concentrations
(from 0.04 to 4 mg/g).
Repeatability and intermediate precision data for
l
-theanine
analysis are presented in Table 2.
The SMPR 2015.014 document approved by the SPDS (8)
sets repeatability and reproducibility requirements for different
levels of
l
-theanine in samples with upper limits for RSD
r
and
RSD
R
being 5–7% and 8–10%, respectively. The RSD
r
for
this method ranged from 0.76 to 2.95% and the intermediate
precision (RSD
iR
) ranged from 1.81 to 5.33%, thereby meeting
the method precision requirements for all the studied matrixes.
Calculated Horwitz ratio values ranged between 0.32 and
0.62 and met the acceptance criteria for within-laboratory
precision with values of 0.3–1.3 (19).
Accuracy Results
The results of the analysis of NIST SRM 3254, SRM 3255,
and SRM 3256 are presented in Table 3 and are in close
agreement with the reference values for
l
-theanine obtained by
the NIST laboratory using an LC-MS method.
Spike recovery studies were completed for a total of seven
matrixes—including SRM 3254, SRM 3255, and SRM
3256—to cover dietary ingredients, such as green tea leaves
and pure green tea extract, in addition to different supplement
formulations.
Spike concentrations varied from 0.02 to 3.6 mg/g and for
most matrixes represented a 50 and 100% overspike of the native
levels. Data for total and marginal recoveries are presented in
Tables 4 and 5, respectively.
Total recoveries ranged between 98.8 and 102.1%, with a
maximum RSD of 3.3% for liquid gelcap samples. Marginal
recoveries ranged between 97.6 and 108.7%, with the highest
SD at 6.4%, again obtained for liquid gelcaps.
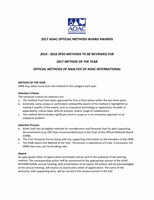
Figure 2. Chromatogram of green tea extract tablet sample. The concentration of theanine in the sample was 0.0410 mg/g.
Figure 3. Chromatogram of a sample of SRM 3256 (green tea-containing solid oral dosage form). Concentration of theanine in the sample
3.949 mg/g.
18