


 28 / 63


Table 2016.16D. LC gradient
Time (min)
% Mobile phase B
Flow rate (mL/min)
0
28
1.40
1.0
28
1.40
2.0
30
1.40
4.0
30
1.40
4.1
50
1.75
6.0
50
1.75
8.5
28
1.40
(
a
)
(
b
)
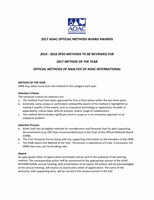
Figure 2016.16. Typical chromatograms from (a) a mixed calibration standard solution and (b)
a turmeric rhizome sample.
28