


 11 / 72

1
2
3
4
5
6
7
8
9
10
11
1
1
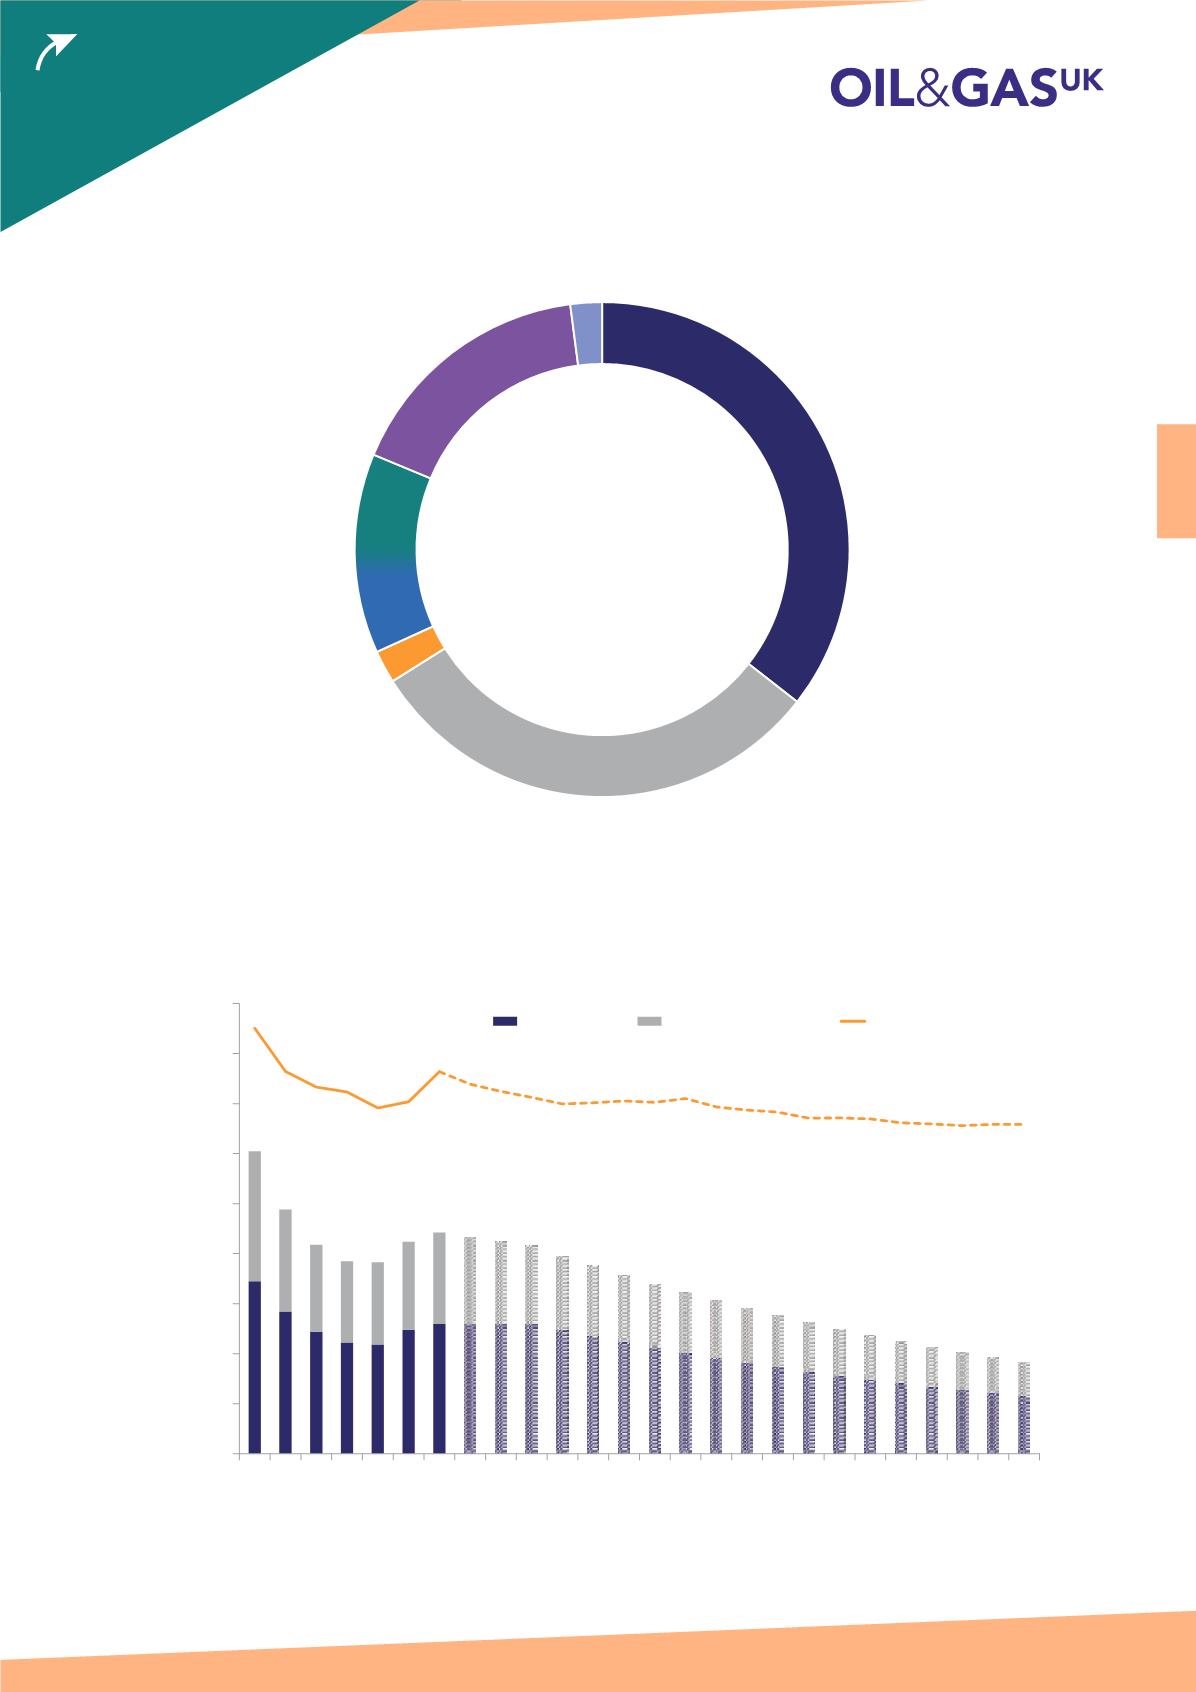
Figure 3: UK Primary Energy Demand by Fuel Type in 2035
Oil
3
6
%
N atural Gas
3 0%
Coal
2
%
R enew ables and Waste
13
%
N uclear
17
%
Other
2
%
by
2035,
it is f orecast
that oil and gas w ill
comprise
66%
of the UK' s
energy mix
Source: B
E
I S
Figure 4: Indigenous Oil and Gas Production and Demand Projection
0
2 0
4 0
6 0
8 0
100
12 0
14 0
16 0
18 0
2 010
2 011
2 012
2 013
2 014
2 015
2 016
2 017
2 018
2 019
2 02 0
2 02 1
2 02
2
2 02
3
2 02
4
2 02
5
2 02
6
2 02
7
2 02
8
2 02
9
2 03 0
2 03 1
2 03
2
2 03
3
2 03
4
2 03
5
Million Tonnes of Oil E
q uiv alent
Oil Production
N atural Gas Production
Oil and Gas D emand
Source: OGA
Open to understand the journey of oil and gas and its role in the energy mix