


 1800-1801 / 2437


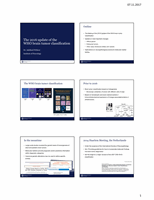
Nivolumab
n = 153
a
Bevacizumab
n = 156
a
ORR, n (%)
[95% CI]
12 (7.8)
[4.1, 13.3]
36 (23.1)
[16.7, 30.5]
BOR, n (%)
CR
PR
SD
PD
Unable to determine
Not treated
Discontinued early due to toxicity
Other
2 (1.3)
10 (6.5)
33 (21.6)
107 (69.9)
1 (0.7)
1 (0.7)
0
0
4 (2.6)
32 (20.5)
73 (46.8)
26 (16.7)
21 (13.5)
16 (10.3)
3 (1.9)
2 (1.3)
Median TTR (range), months
3.0 (1.4–12.0)
1.5 (1.2–6.5)
Median DOR (range), months
11.1 (0.6–18.7)
5.3 (3.1–24.9)
PFS rate [95% CI], %
6-months
12-months
15.7 [10.8, 21.5]
10.5 [6.5, 15.5]
29.6 [22.7, 36.9]
17.4 [11.9, 23.7]
Reardon et al., WFNOS meeting 2017
CheckMate 143
Analyses of responses