


 9 / 24

Committee Meeting
9
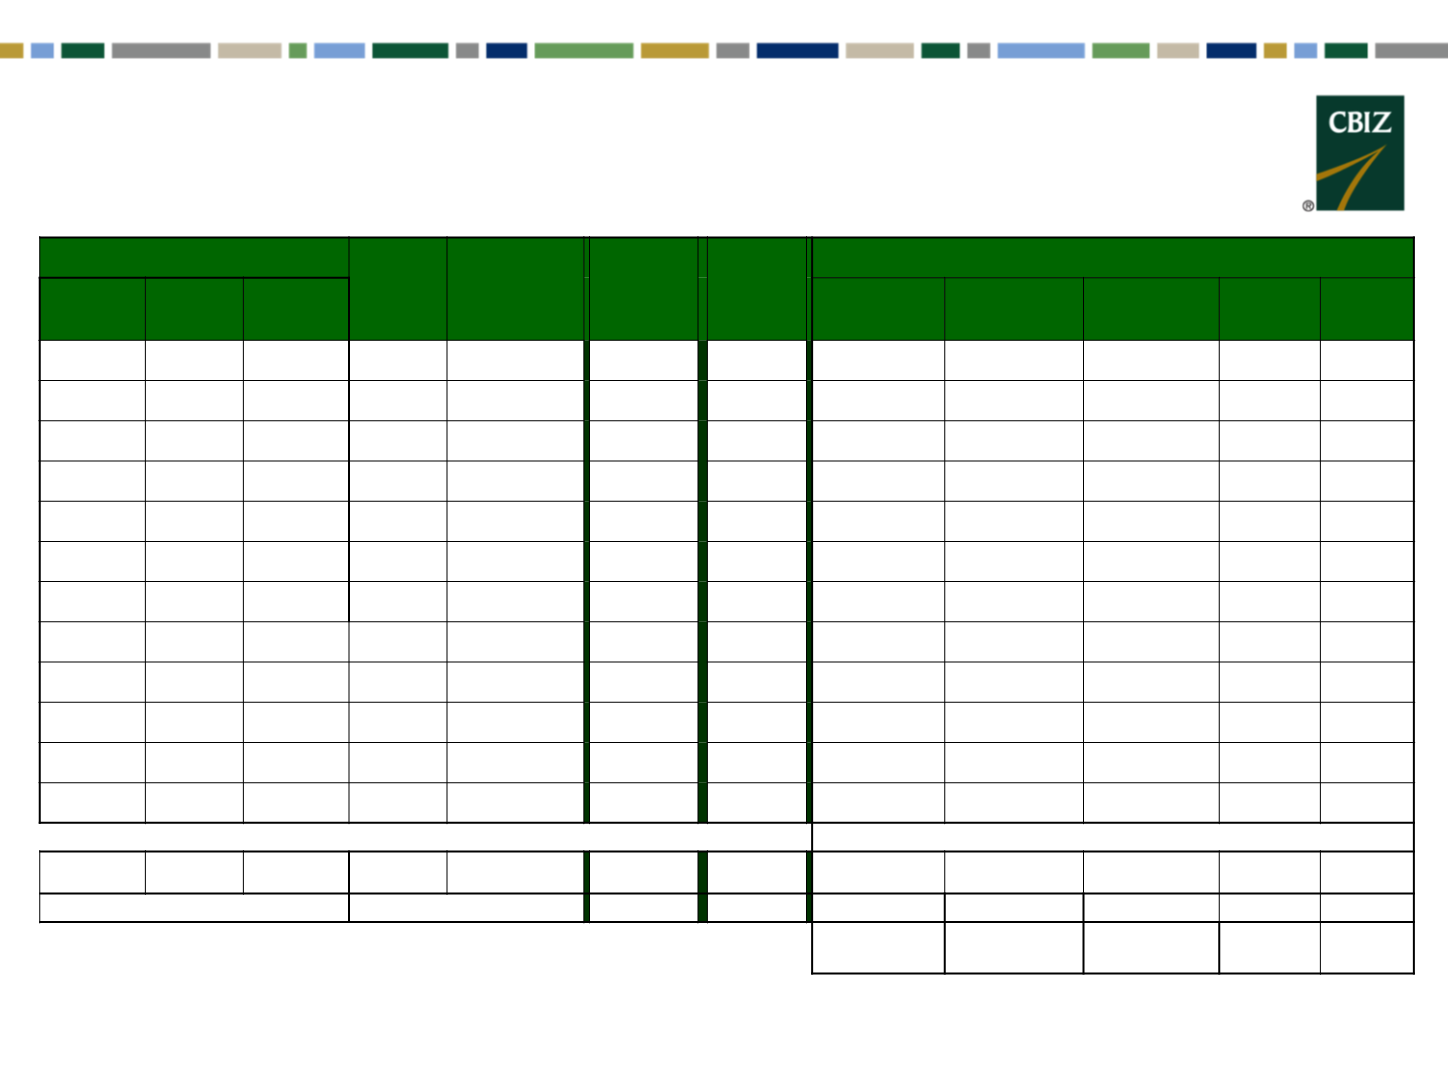
Experience Reports: Jan-Dec 2017
Monthly Paid Claims
Expected
Specific
Claims
Total Paid
Claims
Est. Fixed
Costs
Total Cost
Monthly
Monthly Funding
Medical &
Vision
Dental
RX
1
Total
Employee
Contribution
Employer
Contribution
PEPM
PMPM
$1,026,197 $125,028 $328,840
$0
$1,480,065
$149,849
$1,629,914
$1,973,101
$268,458
$1,704,643 $1,054.96 $593.34
$883,448 $83,498 $387,568
$0
$1,354,514
$147,197
$1,501,711
$1,939,535
$265,624
$1,673,911
$990.57 $552.30
$1,574,858 $106,184 $223,757
$0
$1,904,799
$147,341
$2,052,141
$1,940,852
$264,822
$1,676,030 $1,351.87 $755.57
$1,107,779 $84,049 $457,845
$0
$1,649,673
$148,007
$1,797,680
$1,949,261
$265,813
$1,683,448 $1,178.81 $660.67
$4,592,282 $398,759 $1,398,011
$0
$6,389,051
$592,394
$6,981,445 $7,802,749
$1,064,718
$6,738,032
$1,278
$174
$1,104
$1,144
$640
%
Contribution
14%
86%
Loss Ratio 89%