


 9 / 33

Key Benchmarks Only – Order the full study fro
m www.independentagent.comor 800.221.7917
Pro Forma
Metrics:
Average
Top
Quartile
# of
Employees
7.22
Revenue
per Employee
$120,324
$159,501
Compensation
per Employee
$61,658
$35,908
Spread
per Employee
$58,666
$85,238
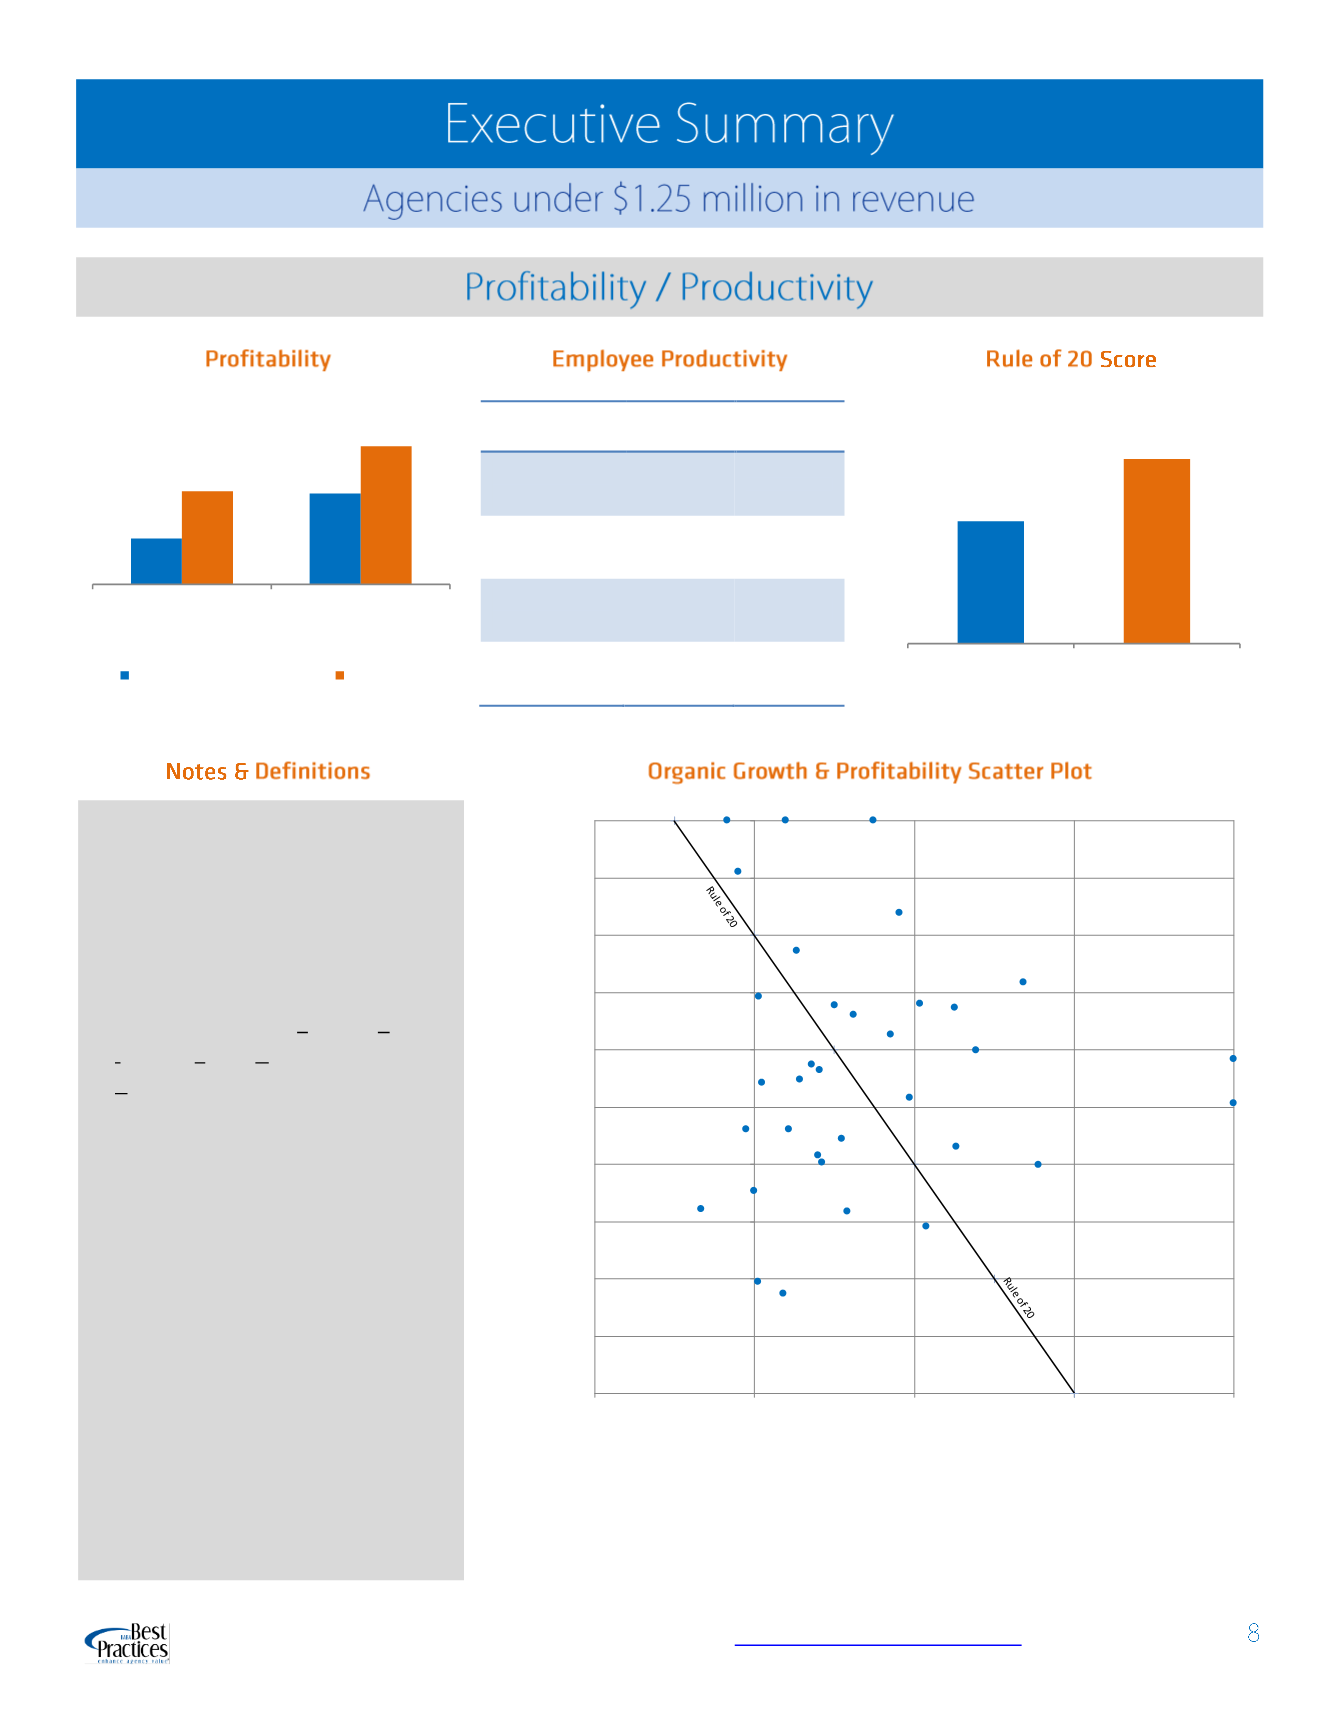
This graph provides a look at the Rule of 20 results for agencies in this revenue category. The solid black line
represents all combinations of organic growth and EBITDA margin that result in a Rule of 20 score of 20.
NOTE: Firms identified as outliers have been set to have a maximum growth of 30% or a maximum
profitability of 50%. They appear on the graph line bordering the chart instead of plotting their actual results.
14.7%
29.0%
29.8%
44.1%
Pro Forma Operating
Profit
Pro Forma
EBITDA
Comparison Group Average
Top Quartile
20.0
30.2
Average
Top Quartile
0.0%
5.0%
10.0%
15.0%
20.0%
25.0%
30.0%
35.0%
40.0%
45.0%
50.0%
-10.0%
0.0%
10.0%
20.0%
30.0%
Profitability (EBITDAMargin)
Organic Growth
Pro Forma Operating Profit is
reported pre-tax profit normalized to
account for non-recurring or non-
operating income and to exclude
contingent / bonus / override
income.
Pro forma EBITDA is Earnings Before
Interest, Taxes, Depreciation and
Amortization, adjusted to add back
discretionary owner expenses and to
normalize non-recurring or non-
operating income and expenses.
The Rule of 20 measures an agency's
shareholder returns. It is calculated
by adding 50% of an agency's Pro
Forma EBITDA margin to its organic
commission & fee growth rate. An
outcome of 20 or higher means an
agency is likely generating, through
profit distributions and / or share
price appreciation, a shareholder
return of approximately 15% - 17%, a
typical agency / brokerage return
under normal market conditions.