


 460-461 / 499


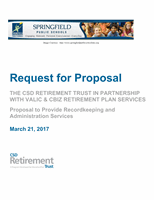
CSD Retirement Trust 403(b) Plan
Vanguard Mid Cap Growth Inv - VMGRX
Monitoring Rating: Pass
Objective
The investment seeks to provide long-term capital
appreciation. The fund invests at least 80% of its assets in
common stocks of mid-size companies. In selecting
investments, each advisor invests in those mid-size
companies that the adviser believes have the best prospects
for future growth. The fund uses multiple investment advisors.
Statistics
Inception Date
12/31/1997
Manager Tenure
10.58
Assets($1000s)
$4,050,477
Net Exp Ratio
0.43
12b-1 Fees
-
Average Mkt Cap($1000s)
$9,418,560
Risk Characteristics
VMGRX Cat Avg
3 Yr Std Dev
12.76 13.30
5 Yr Std Dev
12.40 12.77
5 Yr Beta
1.01 1.01
5 Yr Alpha
-1.95 -1.51
5 Yr Sharpe
0.93 0.94
5 Yr Information Ratio
-0.72 -0.47
5 Yr Tracking Error
2.85 4.19
5 Yr Upside Capture
98.39 96.86
5 Yr Downside Capture
113.47 107.53
5 Yr Batting Avg
0.47 0.47
Excess Returns vs. Category/Index
vs Russell Mid Cap Growth TR USD
vs Category Avg
5
0
-5
-10
10-Yr
5-Yr
3-Yr
12-Month
3-Month
-0.31
-2.07
-2.51
-6.89
0.25
0.73
-0.35
-0.31
-5.59
-0.04
Calendar Year Performance
2012
2013
2014
2015
2016
VMGRX
14.84
34.15
10.86
0.21
0.44
Cat Avg
14.49
35.36
7.19
-0.66
6.03
Index
15.81
35.74
11.90
-0.20
7.33
Cat Rank
49
63
22
44
90
Equity- 12 Month Moving Windows: Dec 2006 - Dec 2016
Vanguard Mid Cap Gro-
wth Inv
Small - Large
2
1
0
-1
-2
Value - Growth
2
1
0
-1
-2
1
0
-1
-
Small Growth
Small Value
Mid Growth
Mid Value
Top Growth
Top Value
Sector Allocation vs. Category
10
5
0
-5
-10
Technology
Industrials
Energy
Telecom
Utilities
Healthcare
Defensive
Real Estate
Financials
Cyclical
Materials
-1.57
-2.99
-0.25
-0.76
-0.56
1.01
-0.64
-0.76
5.7
2.06
-1.82
+/-Category Avg
Asset Allocation
Other (0.00%)
Non-US Bonds (0.00%)
US Bonds (0.00%)
Non-US Stocks (4.00%)
US Stocks (90.12%)
Cash (5.88%)