


 128 / 1498


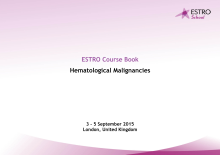
AETHERA
PFS per Investigator
Percent of Subjects Free of PD or Death
0
10
20
30
40
50
60
70
80
90
100
Time (Months)
0
4
8
12
16 20
24 28
32
36 40
44 48
52
N Events (Months)
Median
Stratified
Hazard
Ratio
Placebo+BSC
164 89 15.8
BV+BSC
165 60 --
0.50
164 (0) 113 (48) 92 (67) 83 (76)
77 (81) 71 (85)
61 (88) 45 (89)
28 (89)
23 (89) 13 (89)
3 (89)
3 (89)
0 (89)
165 (0) 149 (12) 133 (27) 122 (36) 111 (45) 103 (52) 90 (55) 62 (58)
40 (59)
33 (60) 16 (60)
4 (60)
3 (60)
0 (60)
N at Risk (Events)
Pla+BSC
BV+BSC
HR = 0.50 [95% CI (0.36, 0.70)]
Median BV = NE (–, –); Placebo = 15.8m (8.5, –)
24-month PFS rate BV = 65%; Placebo = 45%