


 1606 / 1708

BMC Cancer
2008,
8
:15
http://www.biomedcentral.com/1471-2407/8/15Page 4 of 9
(page number not for citation purposes)
Profile of neuropsychological evaluation
In most of the WISC III subtests, scores were within aver-
age limits with mean scores above or equal 8 in 10 of 13
subtests (norms are 10 +/- 2 for each subtest). None of the
patients showed a significant (
≤
2 SD) impairment of VIQ.
Of the VIQ subtests 2 children achieved low test scores in
the "information" subtest testing general knowledge. Four
patients showed significant impairments in the optional
memory subtest. PIQ was below VIQ in 17 patients with a
mean difference of 7.8 points and a significant impair-
ment in 6 patients. A marked impairment was seen in the
chessboard/coding subtest and limited impairments in
object assembly, symbols and picture arrangement, sub-
tests evaluating speed of written performance and the
capacity of visuo-spatial observation and organisation,
respectively. Mean processing speed was also reduced.
Table 2 shows the IQ subtest scores.
All of the 12 tested patients showed impairment in their
reading skills, with a lag of 1 to 5 years between "reading
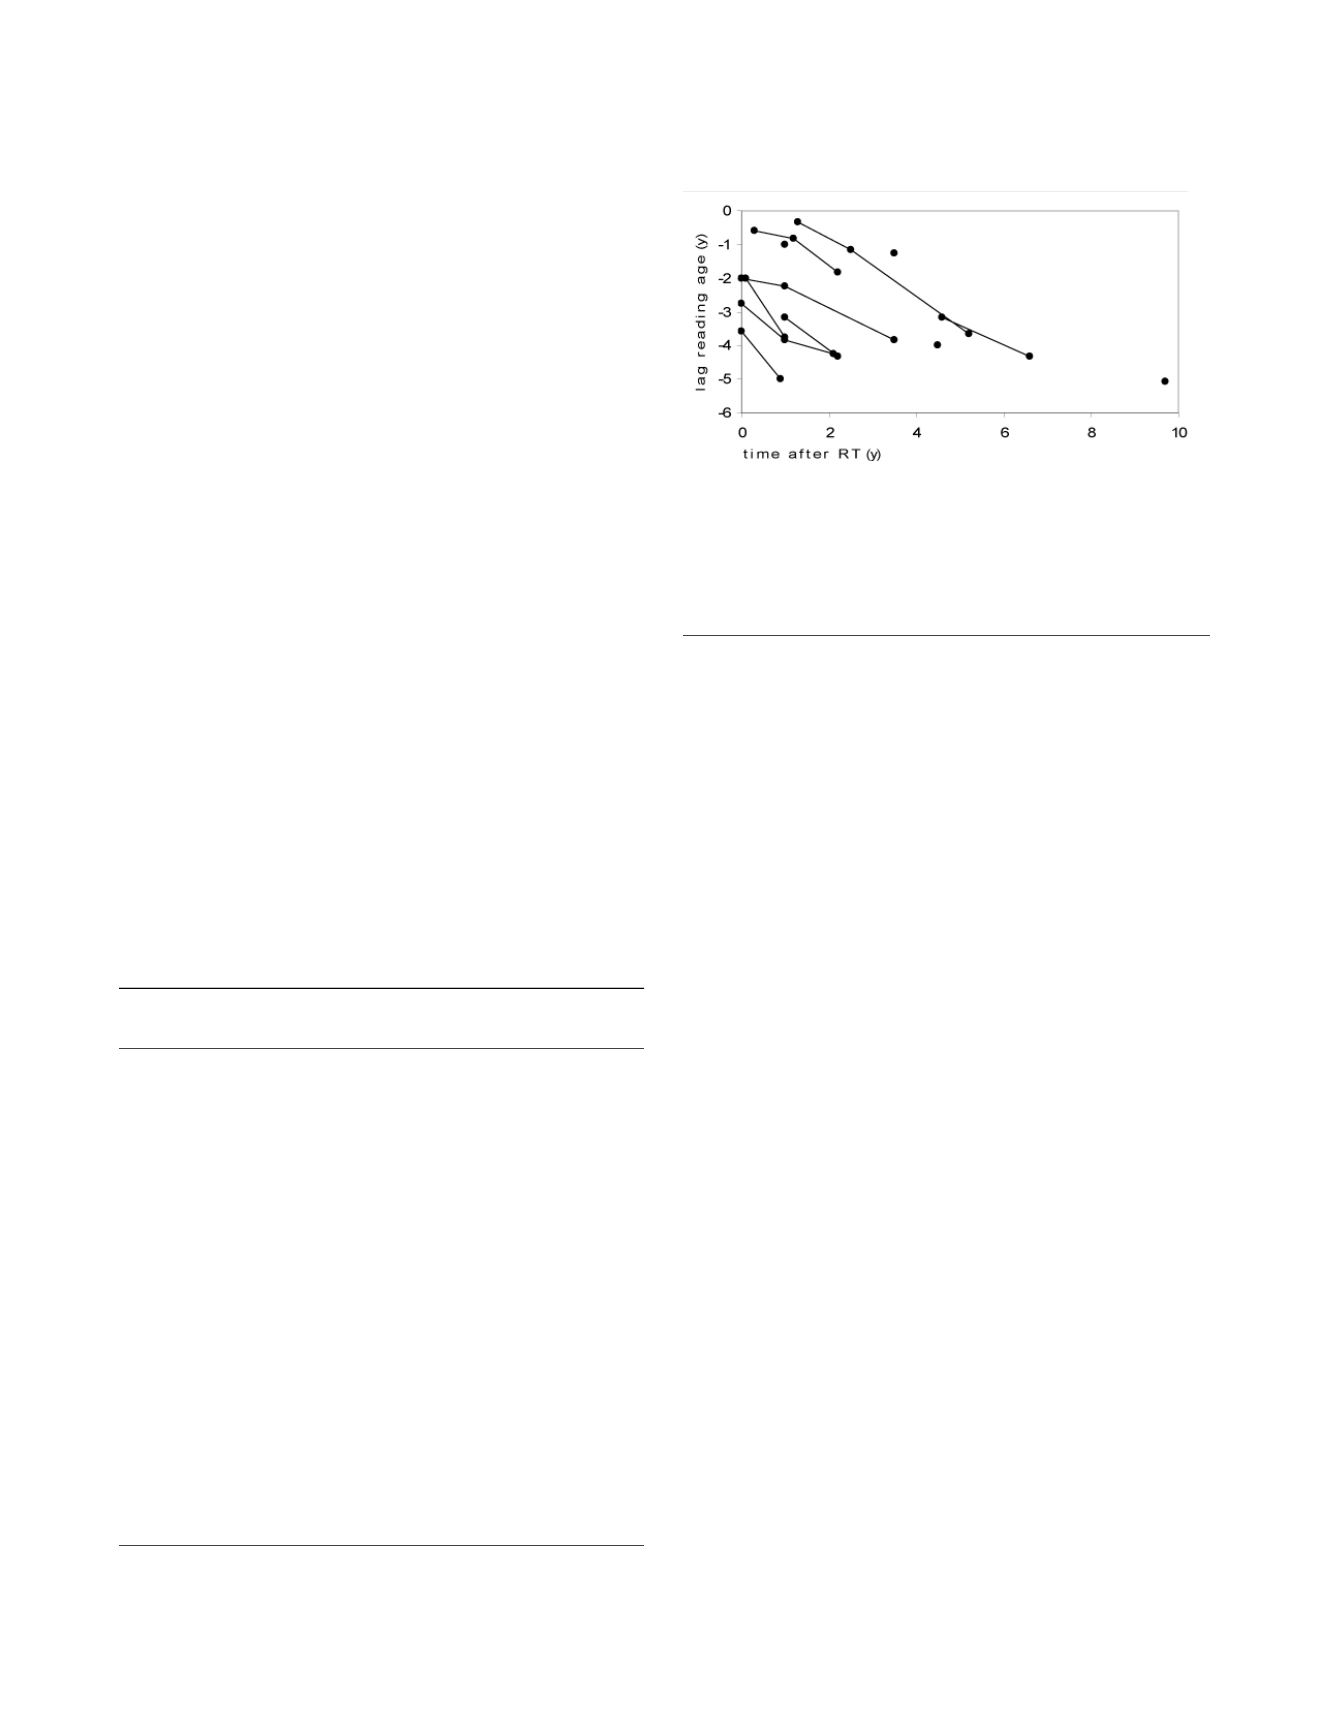
age" and chronological age (median 3.8 years). The dis-
crepancy was growing with time in all 8 patients with
sequential testing (figure 1). Concerning visuospatial
capacities, 3 of 16 patients had severe difficulties in repro-
ducing the Rey-Osterrieth complex figure (mean Z-score
of the whole group being -1.01 SD) while none of 11
patients tested had severe difficulties with the benton line
orientation test (mean Z-score of the whole group being
0.56 SD). Short term memory measured by digit span was
significantly diminished in 1 of 10 tested patients (mean
Z-score of the whole group being-0.62 SD) and long term
memory measured by word list was significantly dimin-
ished in 3 of 19 tested patients (mean Z-score of the whole
group being -0.92 SD). Overall results of 12 patients who
received the wisconsin card sorting test (WSCT) were
within average limits, but 7 of these 12 showed atten-
tional deficits with slow adaption, the tendency to keep
one strategy, difficulties with reasoning, and problems to
maintain the intentional thread. Difficulties within the
WSCT were not correlated to the IQ scores.
Except reading skills, none of the tests showed declining
results over time after therapy.
Risk factor analysis (see table 3)
Age
Low IQ results occurred mainly in the young age group.
Figure 2 shows the distribution of FSIQ values at last eval-
uation and age at irradiation. Comparing the IQ results of
children younger than 5 years at irradiation with children
who were older at the time of irradiation, the difference
failed significance but there was a trend for poorer out-
come in younger children. Mean FSIQ was 82.7 (n = 8, SD
17.2), and 92.5 (n = 15, SD 12.8) respectively (p = 0.1).
Interval since RT and FSIQ
Of 13 patients with a baseline evaluation, 10 patients
were tested before the start of irradiation and three
patients within the first year after completion of radio-
therapy. One of these patients was below 3 years of age at
diagnosis, therefore he received age adapted tests without
IQ testing. Of the remaining 12 patients mean baseline
FSIQ, VIQ and PIQ (SD) was 91.6 (10.6), 98.4 (8.9) and
85.8 (13.6). The only patient with a baseline FSIQ below
75 was diagnosed at 2.5 years and received delayed RT
Reading performances
Figure 1
Reading performances
. Differences between chronologi-
cal age and reading age in years of 12 patients at different
time points after therapy (4 had one test, 8 had sequential
testing); Results of individual patients are connected with
lines.
Table 2: Wechsler scale (WISC-III) subtest results of 23 patients.
Number of patients with
scores below minus 2 SD
mean
Full scale IQ
2/23
89.1
Verbal IQ
0/23
94.0
Performance IQ
6/23
86.2
Verbal comprehension
2/22
94.5
Perceptive organization
1/22
92.1
Speed
4/22
86.6
Verbal subtests
Information
2/23
8.4
Similarities
0/23
9.3
Arithmetics
0/23
9.8
Vocabulary
0/23
9.1
Comprehension
1/23
9.4
Memory
4/22
8.0
Performance subtests
Picture completion
3/23
9.4
Codes
6/22
5.9
Picture arrangement
2/22
8.2
Block design
2/22
8.5
Object assembly
5/21
7.9
Mazes
1/22
9.6
Symbols
3/22
7.9
SD = standard deviation.
IQ = Intellectual Quotient