


 149 / 155

2011 Best Practices Study
Key Benchmarks
Profile
Revenues
Expenses
Profitability
Employee Overview
Producer Info
Staff Service Info
Technology
Insurance Carriers
Appendix
2011 Best
Practices Study
149
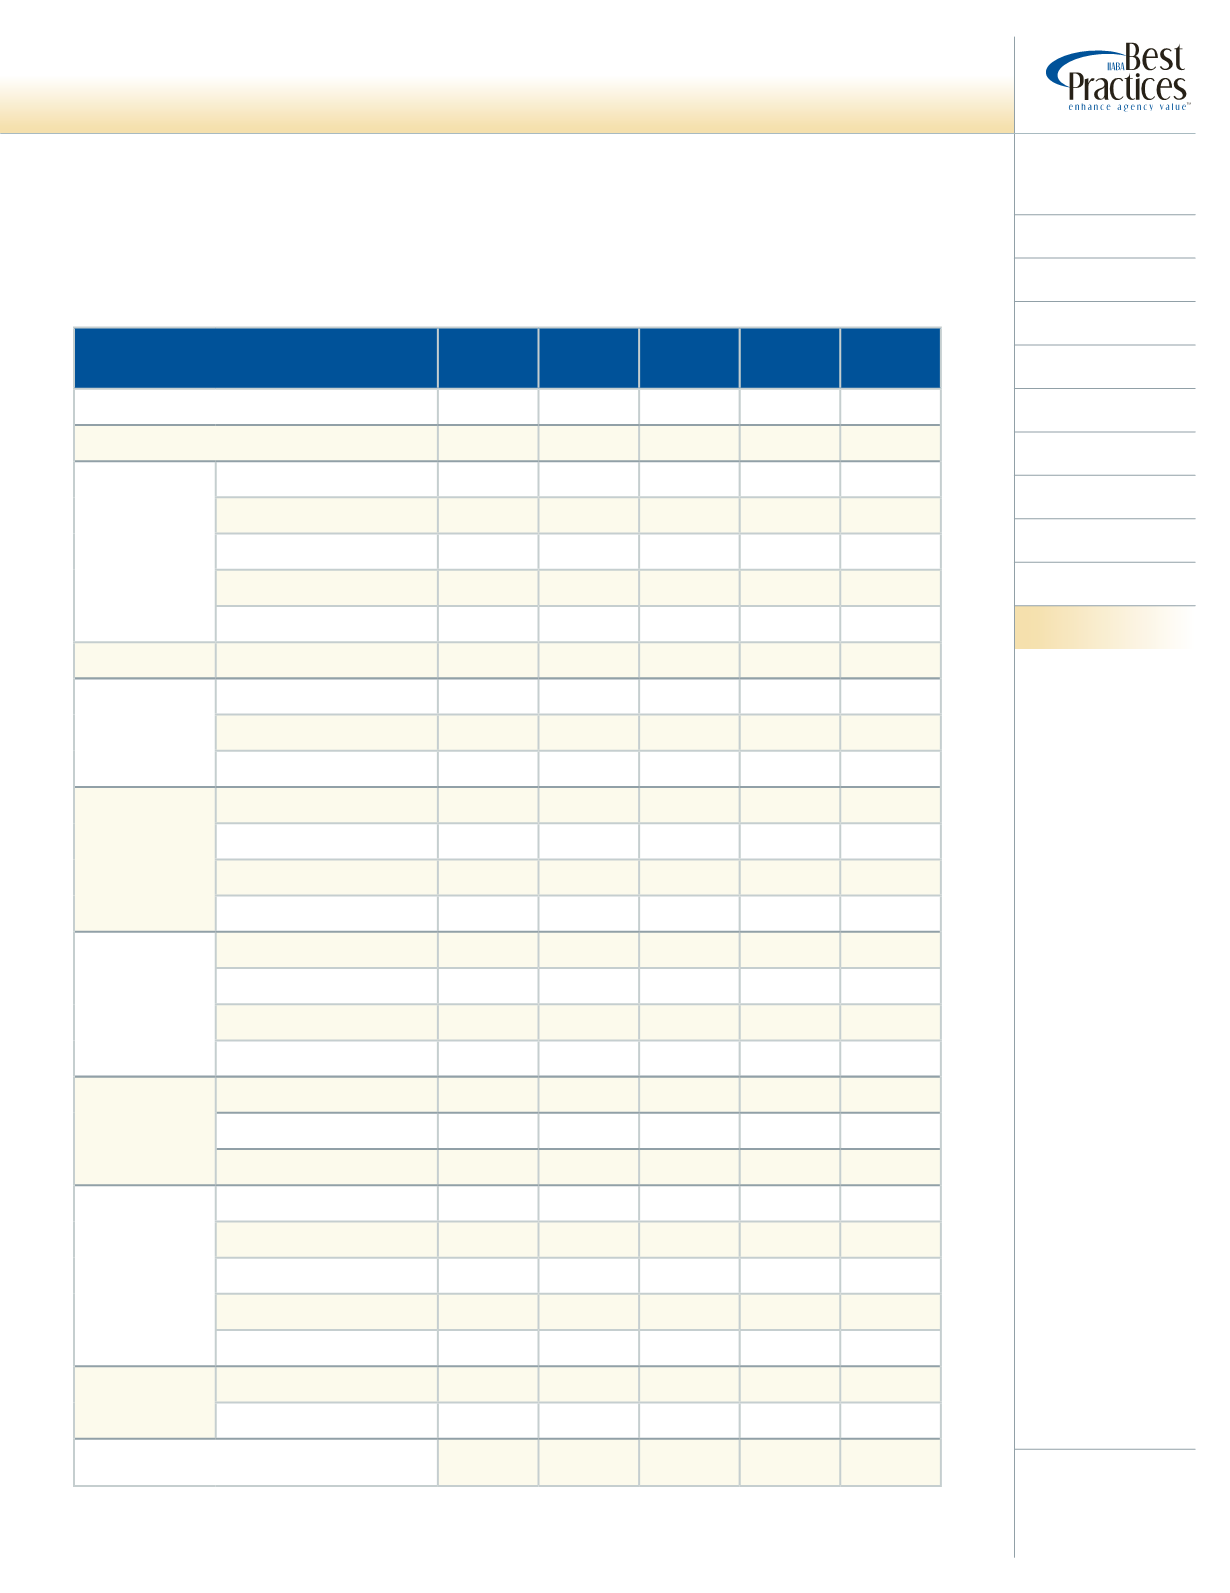
Regional Analysis
Agencies with Revenues OVER $5,000,000
Geographic Region:
Northeast Southeast Midwest Southwest
West
% of Agencies Located in Each Region
12.6% 11.1% 9.2% 7.2% 7.2%
Net Revenue Growth (Organic)
1.2% 1.2% 4.7% -0.8% -0.6%
Profitability as %
of Net Revenues
Pre-tax Profit
14.6% 14.2% 10.3% 13.0% 12.0%
Pro Forma Pre-tax Profit
18.6% 17.3% 13.0% 17.9% 13.9%
Operating Pre-tax Profit
2.9% 5.8% 0.2% 3.7% 3.6%
EBITDA
20.4% 16.9% 14.5% 14.8% 14.6%
Pro Forma EBITDA
24.4% 20.0% 17.2% 19.8% 16.5%
Value Creation “Rule of 20” Score
13.4
11.2
13.3
9.1
7.7
Productivity
Revenue per Employee
$172,513 $160,353 $169,121 $167,774 $180,562
Compensation per Employee $105,209 $106,388 $117,336 $114,155 $121,835
Spread per Employee
$67,304 $53,965 $51,785 $53,619 $58,727
Pay Levels for
Producers
Commercial P&C
$178,466 $220,853 $218,154 $194,232 $200,031
Personal P&C
*
$91,986 $68,410 $98,645 $123,413
Life & Health / Financial
$204,745 $232,116 $215,353 $225,714 $199,744
Multiline
$117,281 $263,786 $318,838 $239,056 $223,416
Pay Levels for
Service / Sales
Support Staff
Commercial P&C
$54,117 $48,440 $50,016 $53,565 $58,462
Personal P&C
$42,316 $40,531 $43,359 $44,246 $50,339
Life & Health / Financial
$55,921 $48,235 $49,256 $50,414 $58,606
Multiline
*
*
*
*
*
Pay Levels for
Account Execs
Commercial P&C
$82,476 $87,707 $91,391 $71,648 $106,675
Personal Lines
$65,798 $60,290 $58,839
*
$73,114
Life & Health / Financial
$78,420 $85,400 $89,794 $65,121 $111,610
Number of
Carriers
PL - National
8.1
10.1
7.2
11.5
14.1
PL - Regional
7.9
10.8
10.6
3.9
4.0
CL - National
17.2
33.2
17.5
45.0
52.7
CL - Regional
13.1
24.5
30.6
14.9
15.3
EB - All
38.4
54.5
54.3
30.9
68.9
Service Center
Use
Total PL Comms Placed
26.0% 17.0% 25.8% 24.6% 20.5%
Total CL Comms Placed
4.8% 2.0% 1.2% 3.6% 2.0%
% of Agencies Making an Acquisition in the
last 12 Months
30.8% 8.7% 10.5% 13.3% 20.0%
*Insufficient Data