


 8 / 8
8 / 8
8
caceis news
- No. 50 - June 2017
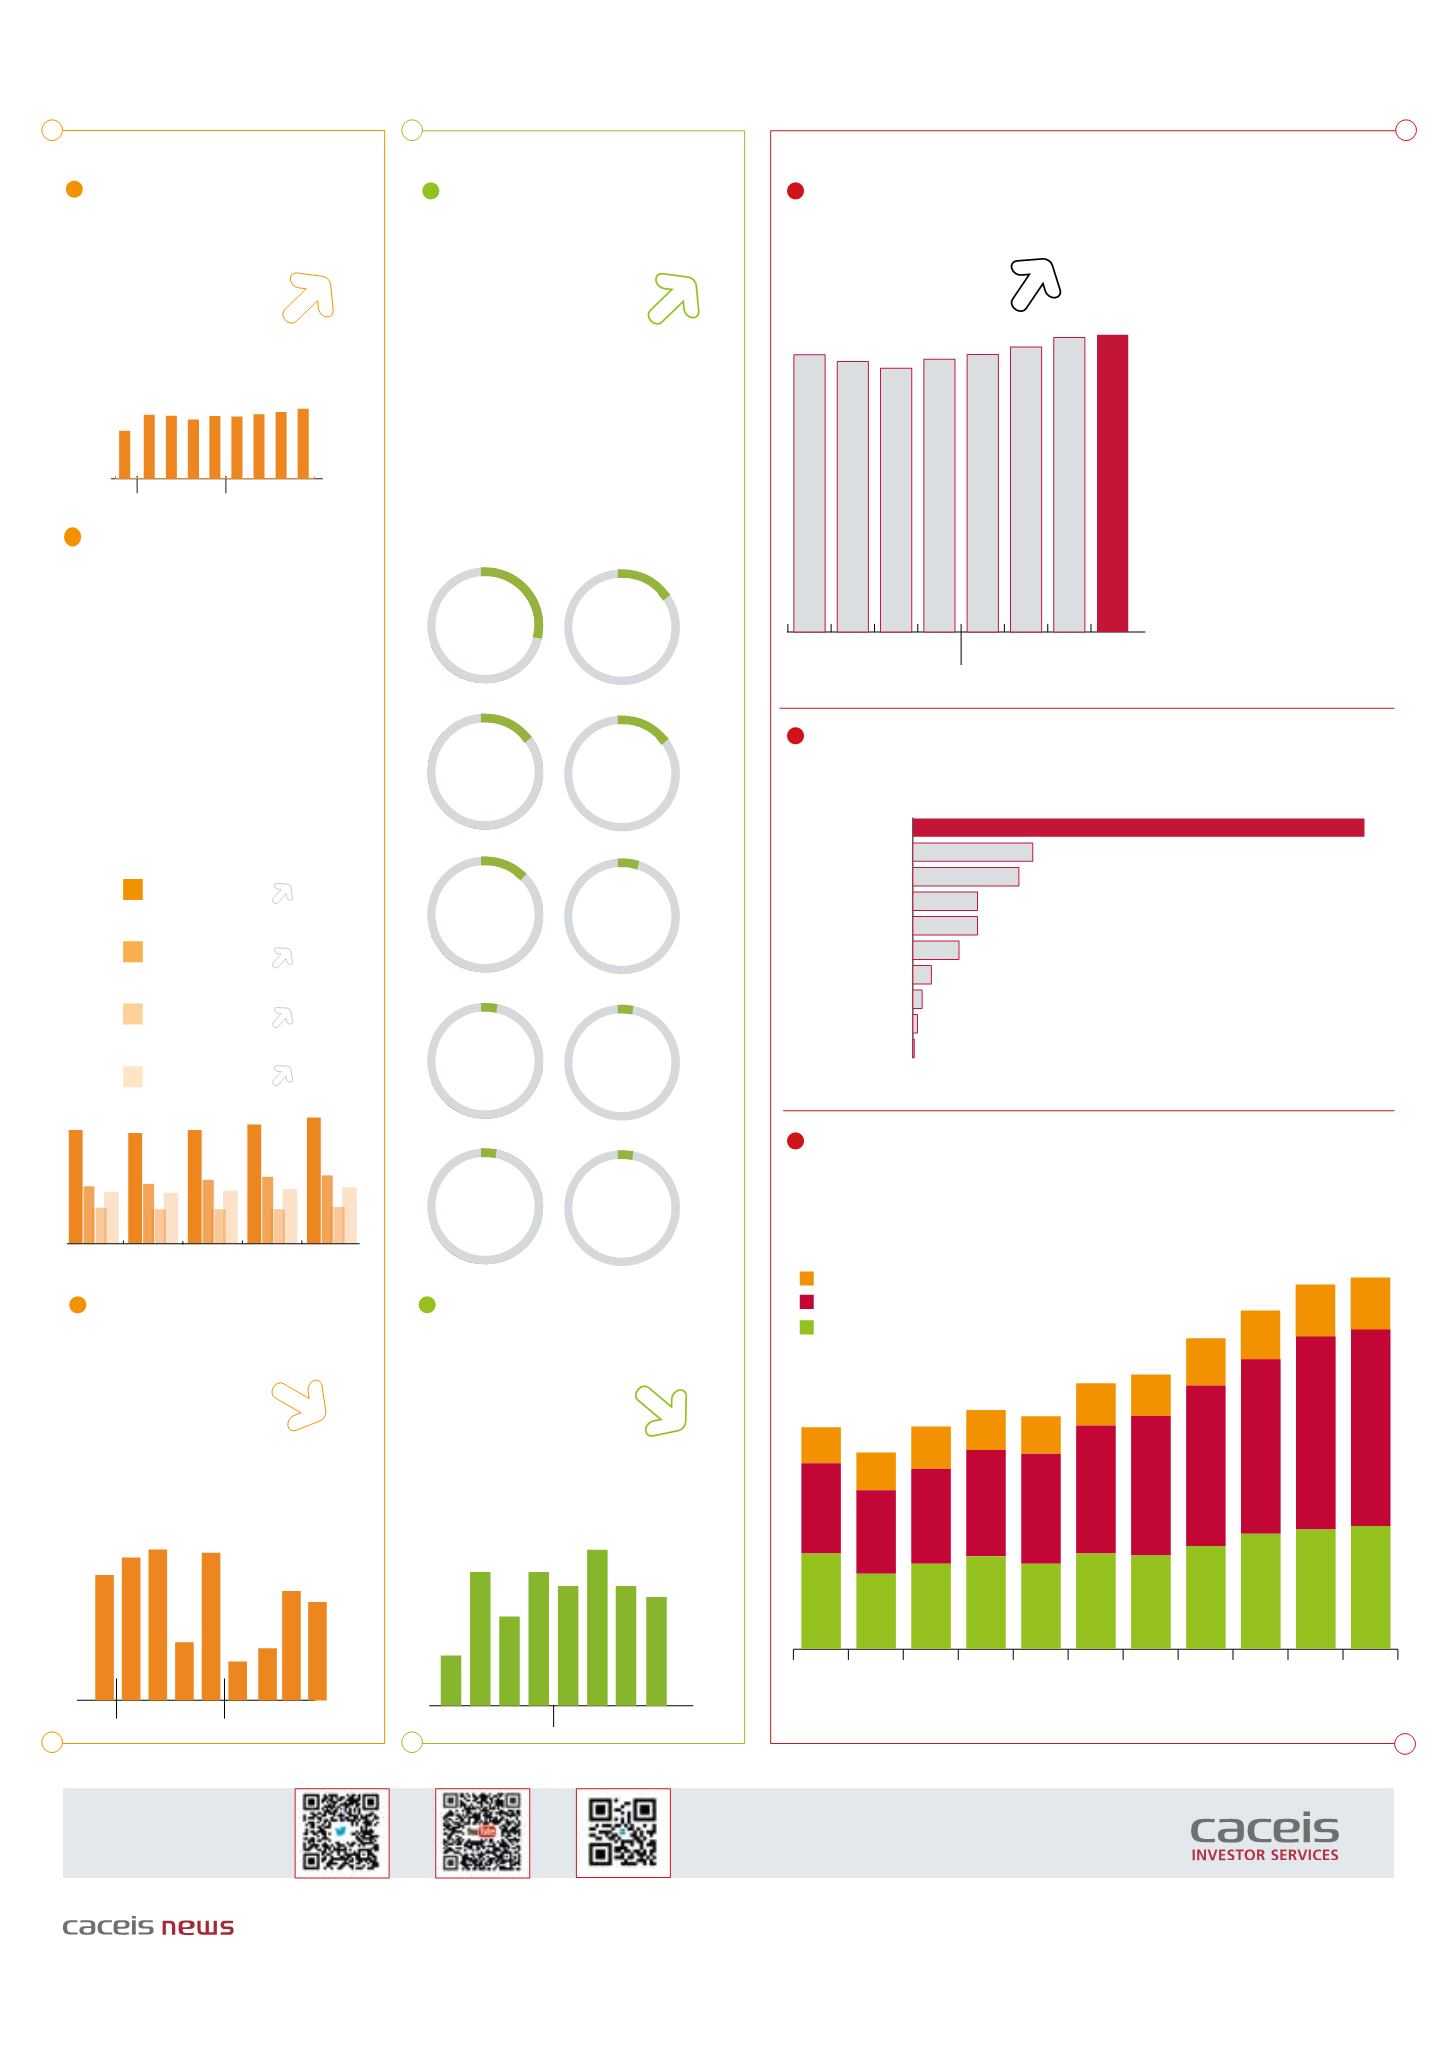
Worldwide
Source: EFAMA - May 2017
Europe
2016 was another record year for the
European investment fund industry, with net
assets of investment funds rising to an all-
time high of €14.14 trillion, by 6.1% to end
2015. Net assets of UCITS increased 3.75%
in Q4 2016 to €8.65 trillion, and total net
assets of AIFs by 2.35% to €5.48 trillion.
Source: EFAMA - May 2017
Worldwide Investment
Fund Assets Q4 2016 (€ trillion)
Net asset of the European
Fund industry Q4 2016
(€ trillion)
Worldwide investment fund assets increased 4.8%
in the fourth quarter of 2016 to €41.29 trillion.
2014 2015
2016
€41.29tr
+6.0%
+3.2%
+5.5%
+4.1%
€14.14tr
+3.2%
/Q3 2016
Luxembourg
€
3.7
tr
Ireland
€
2.1
tr
Germany
1.9
tr
France
€
1.8
tr
UK
€
1.4
tr
€
Netherlands
€
801
bn
Switzerland
€
537
bn
Sweden
€
303
bn
Italy
€
297
bn
Denmark
€
276
bn
Net cash flow to Investment
Funds - Q4 2016 (€ billion)
Worldwide net cash flow to all funds amounted
to €388 billion in the fourth quarter of 2016,
compared to €432 billion during the third quarter
of 2016.
2014 2015
2016
495
564
596 583
230
154
207
432
388
-10.18%
/Q3 2016
Net sales of AIF
Q4 2016 (€ billion)
Trends by investment type
Q4 2016 (€ trillion)
-9%
/Q3 2016
Top Ten at end 2016
€16.4tr
€8.9tr
€4.8tr
€7.3tr
Equity
Money
Market
Bonds
Balanced
At the end of the fourth quarter of 2016, equity
funds net assets increased by 6.0% to €16.4
trillion and bond funds net assets by 3.2% to €8.9
trillion. Balanced/mixed fund assets increased
by 4.1% to €7.3 trillion and money market fund
assets by 5.5% globally to €4.8 trillion.
40% of worldwide regulated open-ended fund
net assets were held in equity funds. The net asset
share held by bond funds was 22% and the net
asset share of balanced/mixed funds was 18%
(unchanged from the quarter before). Money
market fund net assets represented 12% of the
worldwide total.
+4.8%
/Q3 2016
€388bn
€39bn
Publishing Director:
Eric Dérobert -
Editor:
Corinne Brand
+33 1 57 78 31 50
corinne.brand@caceis.com-
Design:
Sylvie Revest-Debeuré
Photos credit:
Notified on pictures -
Printer:
GRAPH’IMPRIM certified Imprim’vert®. This document is printed on Cyclus paper, 100% recycled fiber, certified Blaue Engel, Nordic Ecolabel and Ecolabel européen -
Number ISSN:
1952-6695. For further information on our products and services, please contact your Business Development Manager. This newsletter has been produced by CACEIS. CACEIS cannot be held responsible
for any inaccuracies or errors of interpretation, which this document may contain.
www.caceis.comFollow us
2015
2016
18
32
48 48
43 41 39
56
0
2000
4000
6000
8000
10000
12000
14000
16000
2015
2016
Q4
Q1
Q2
Q3
Q4
AIF recorded net inflows of €39 billion during the
fourth quarter of 2016, down from €43 billion in
the third quarter.
Net assets in Germany
increased by 1.0% in the
fourth quarter of 2016,
compared to 3.2% in
Europe, and by 9.1% year
to date.
The investment companies represented by the BVI
*
manage assets of €2.8 trillion on behalf of
over 50 million private and institutional investors.
Country Focus Germany
Q1
2015
2016
Q2 Q3 Q4 Q1 Q2 Q3 Q4
1683
1,757 1,715 1,672 1,729 1,760 1,807 1,867 1,885
Net assets in Germany (domiciliation of funds)
Q4 2016 (€ billion)
Net sales of AIFs in 2016
(€ billion)
Total net assets under management (AuM) in Germany
as at 28 February 2017 (€ billion)
Source EFAMA
€1.88tr
+9.1%
/Q4 2015
Source : EFAMA
*
Source: BVI (BVI, the German investment funds association, compiles reliable and comprehensive statistics
about the German investment market based on the original data from its members)
NET ASSETS
VARIATION
NET ASSETS
Liechtenstein 0.3
Finland 1
Austria 2
Switzerland 4
Spain
10
France
14
Netherlands
14
Ireland
23
Luxembourg
26
Germany
98
2007
731
692
276
1,699
Discretionary mandates
1,505
1,705
1,832 1,783
2,037 2,105
2,383
2,601
2,801 2,853
2008
576
640
289
2009
652
729
325
2010
710
815
307
651
846
286
730
982
325
716
1,070
318
789
1,231
363
883
1,339
378
915
1,482
403
941
1,509
403
2011 2012
2013 2014 2015 2016 2017
Spezialfonds
Retail funds
In 2016, AIFs domiciled in Germany
captured 53% of the total net sales of AIFs
funds in Europe, i.e. €184 billion.