


 11 / 68

73
A
pricot
apricot control, discussed the potential data
points for each of the ten factors for each
jam (Fig. 2). Sensory sessions took place in
classroom settings with overhead cool white
florescent lighting (538 Lux) and room tem-
perature conditions (21°C). Each panelist
was provided adequate space to evaluate his
or her samples. However, physical barriers
did not separate panelists.
Since evaluators marked the first nine sen-
sory characteristics in the linear box plots
(Fig. 2), these were transformed into quanti-
tative data points, based on measuring (mm)
from the beginning (far left-hand side) of
the scale to wherever the panelist made their
mark. This value was then divided by the to-
tal length of the scale and then multiplied by
ten to give data points on a ten-point scale.
Data Analyses.
One-way Analysis of Vari-
ance (ANOVA) as well as mean separations
with Tukey’s Honest Significant Difference
(HSD) tests
a
=0.05 were carried out for
all quantitative data. Quantitative chemical
analysis and ratings data were also analyzed
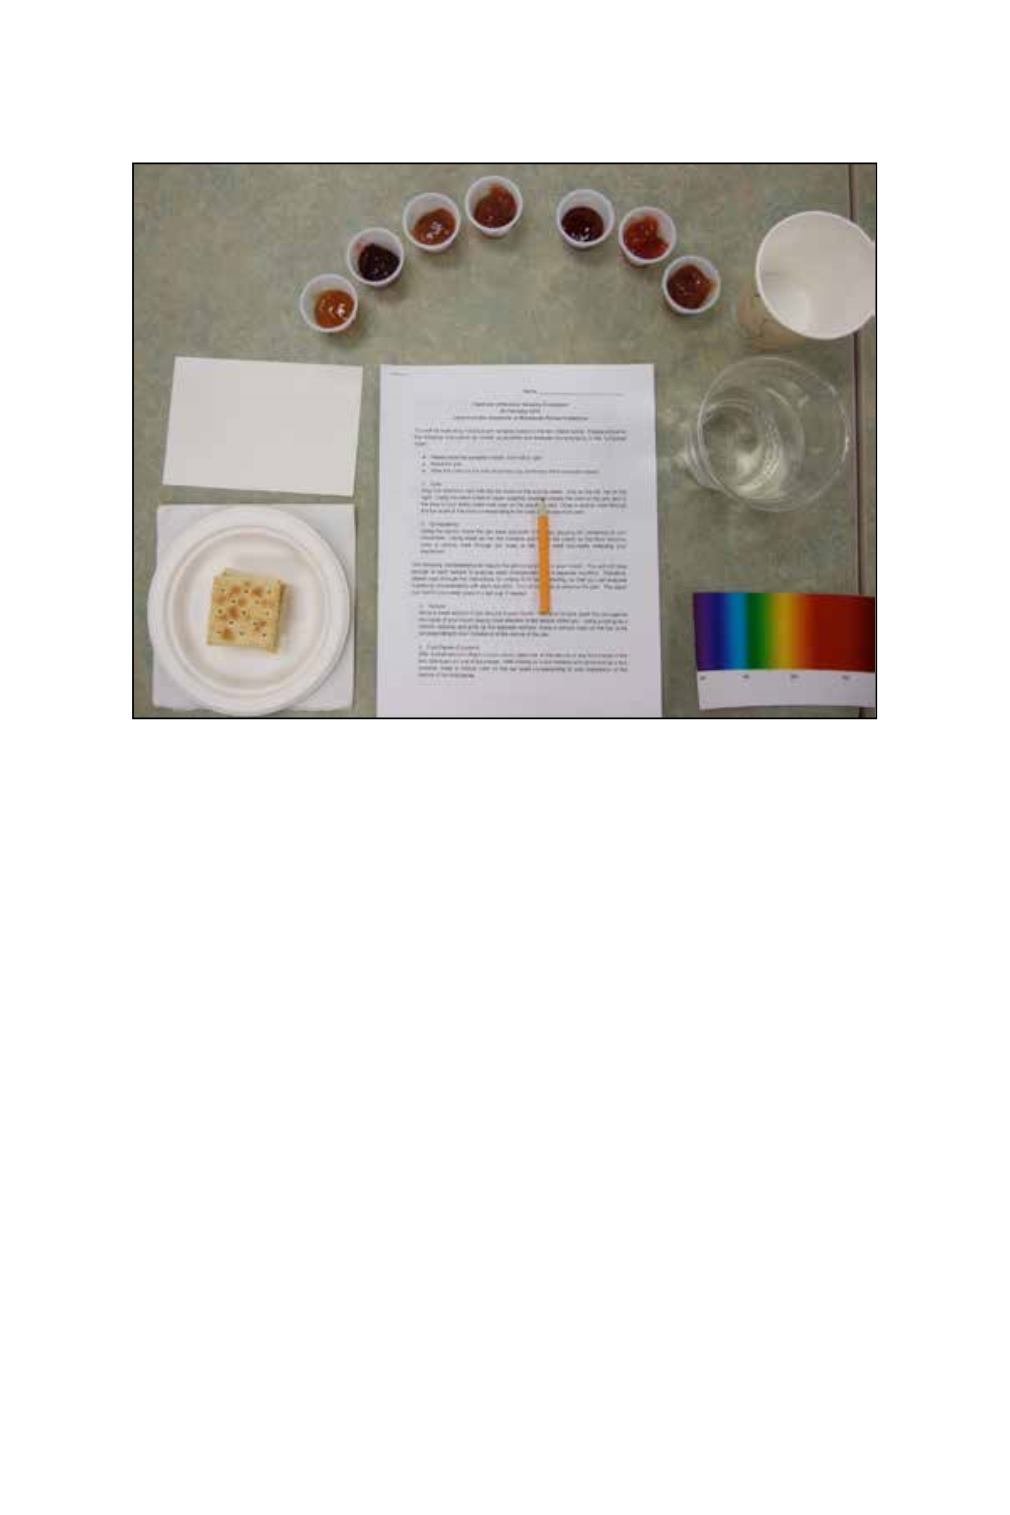
Fig. 3.
Setup of all items used in the sensory evaluation panels (see text)
using principle components analysis. Quali-
tative data, specifically desire to purchase,
was analyzed using a Chi-square test with
equal distribution across the two classes (1:1
c
2
). Since there was only 1 degree of free-
dom for the Chi-square test, the Chi-square
correction of (Observed-Expected-0.5)
2
was
used. Pearson’s Rank Correlations were car-
ried out between variables.
Results
Chemical analyses.
Mean soluble solid
concentration of jams ranged from 48.87°
Brix for the tart cherry control to 68.47° Brix
for MN604 (Table 1). The tart cherry control
and ‘Westcot’ differed significantly for sol-
uble solid concentration from all other jams
(Table 1). In addition, MN604 differed sig-
nificantly from both ‘Sungold’ and the cherry
control (Table 1).
The range in mean pH values was 3.00
for MN604 and ‘Sungold’ to 3.35 for the tart
cherry control (Table 1). The tart cherry con-
trol pH differed significantly from all other