


 8 / 8
8 / 8
8
caceis news
- No. 51 - October 2017
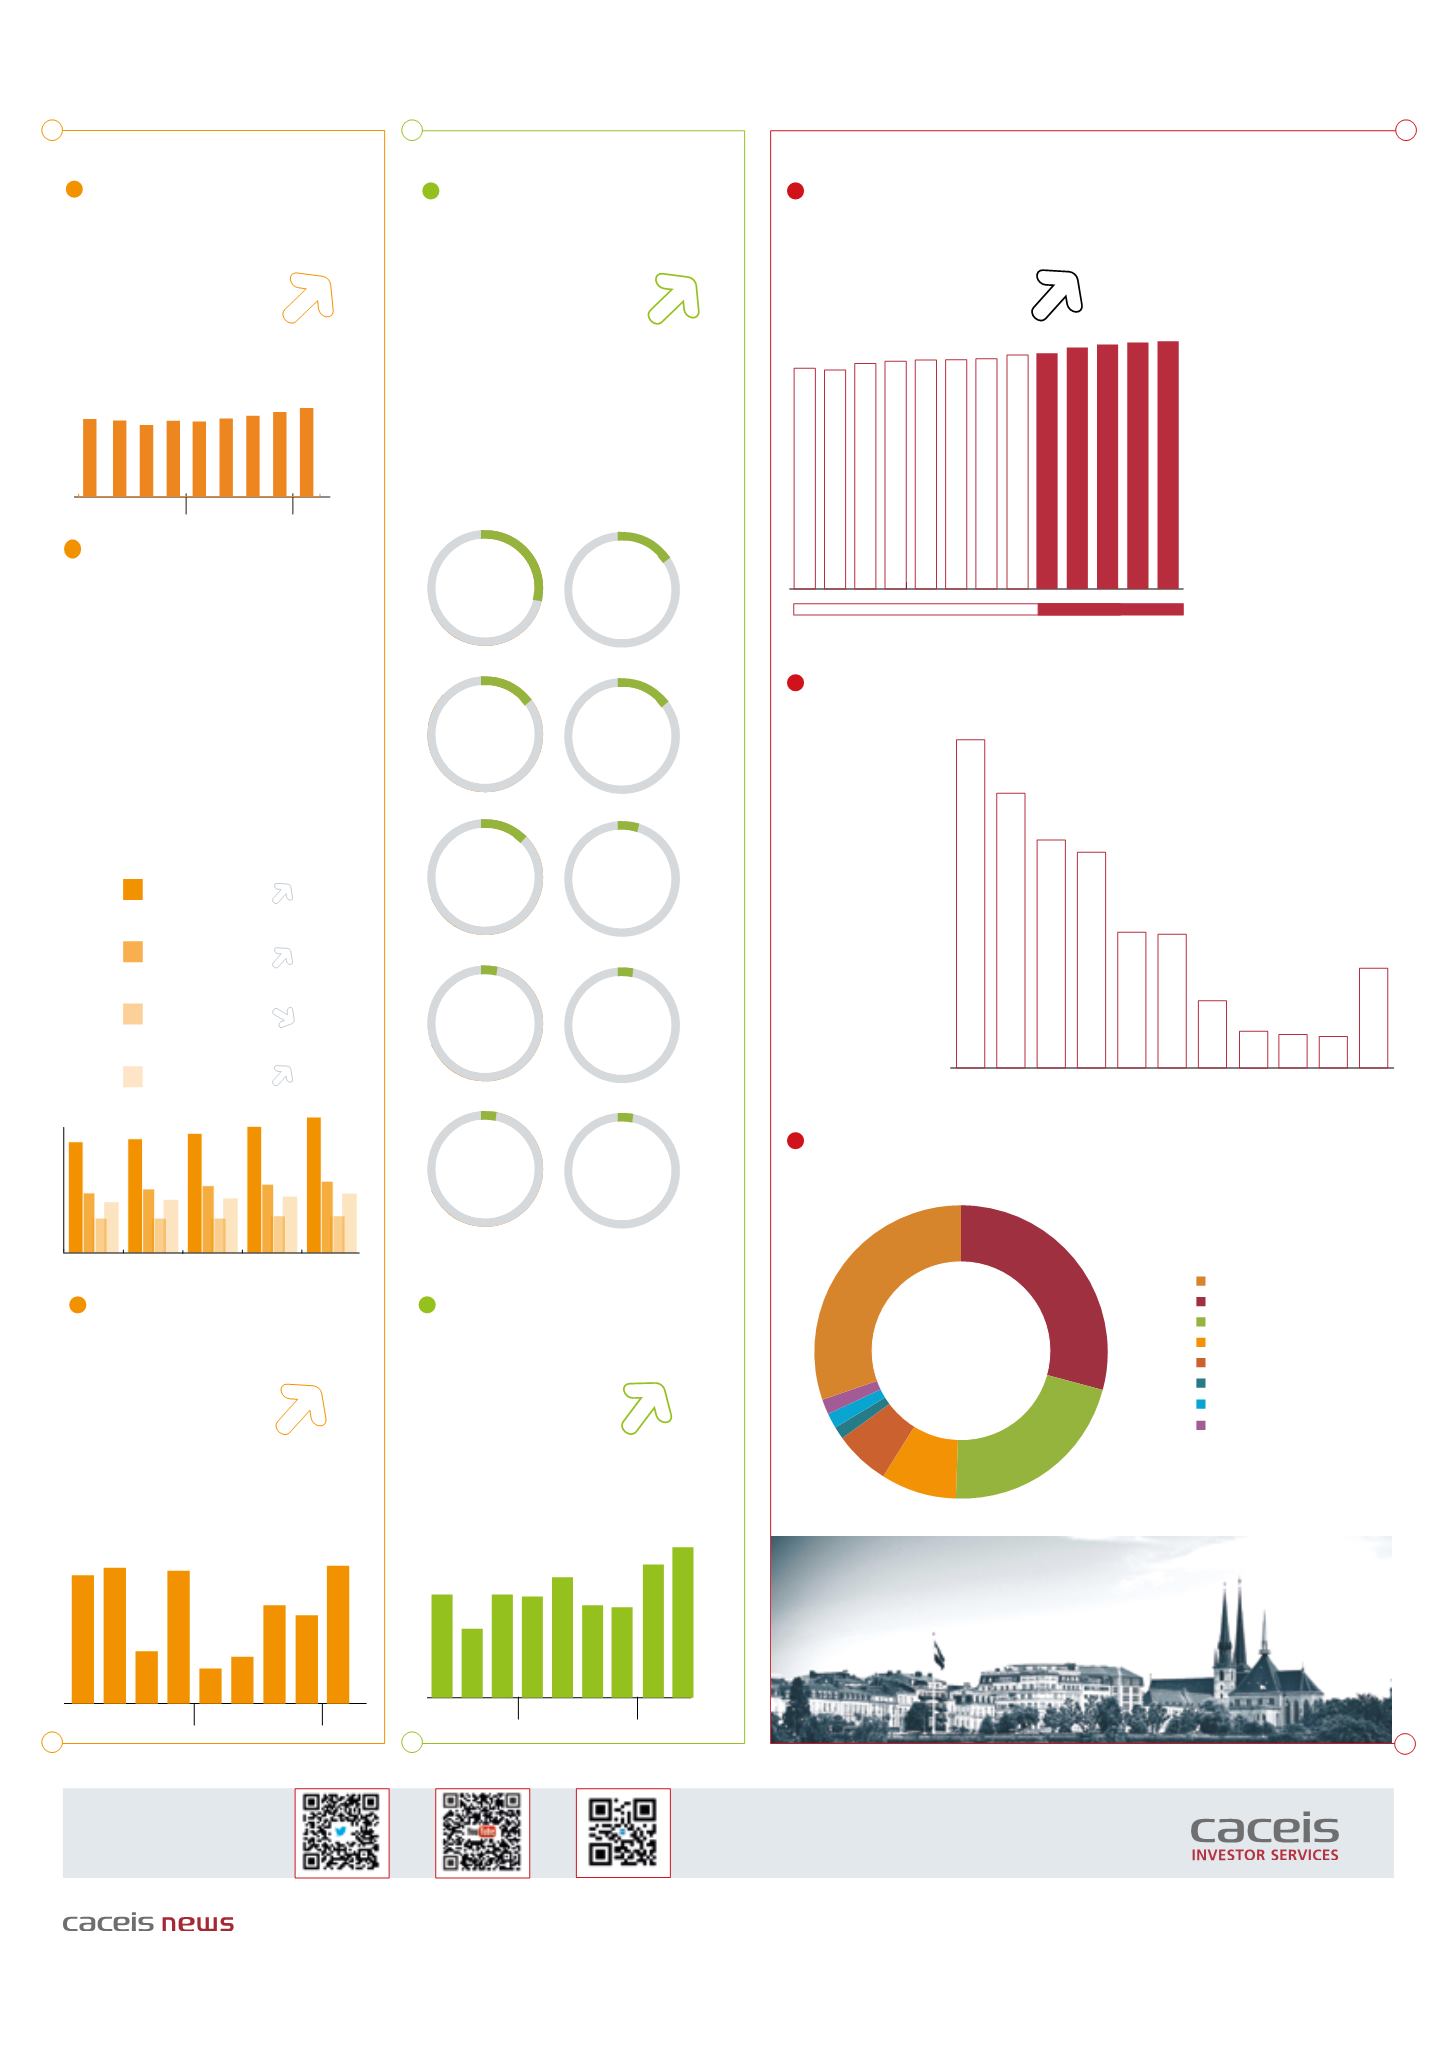
Worldwide
Source: EFAMA - September 2017
Europe
With €9.17 trillion invested in UCITS,
this segment accounted for 61.6% of total
European investment fund assets at end Q2
2017, with the remaining 38.4% (or €5.72
trillion) coming from AIFs.
Source: EFAMA - September 2017
Worldwide Investment
Fund Assets Q1 2017 (€ trillion)
Net asset of the European
Fund industry Q2 2017
(€ trillion)
Worldwide investment fund assets increased 4.6%
in the first quarter of 2017 to €43.19 trillion.
2015
2016 2017
€43.19tr
+6.8%
+4.7%
-1.0%
+4.9%
€14.89tr
+5.3%
/Q4 2016
Luxembourg
€
3.9
tr
Ireland
€
2.2
tr
Germany
1.97
tr
France
€
1.88
tr
UK
€
1.53
tr
€
Netherlands
€
816
bn
Switzerland
€
555
bn
Sweden
€
325
bn
Italy
€
309
bn
Denmark
€
284
bn
Net cash flow to Investment
Funds - Q1 2017 (€ billion)
Worldwide net cash flow to all funds amounted
to €605 billion in Q1 2017, compared to €388
billion in the last quarter of 2016.
2015
2016 2017
564 596
605
583
230
154 207
432
388
+56%
/Q4 2016
Net sales of AIFs
Q2 2017 (€ billion)
Trends by investment type
Q1 2017 (€ trillion)
+66%
/Q4 2016
Top Ten at Q2 2017
€17.6tr
€9.3tr
€4.8tr
€7.7tr
Equity
Money
Market
Bonds
Balanced
At the end of Q1 2017, equity fund net assets
increased 6.8% to €17.6 trillion and bond fund
net assets 4.7% to €9.3 trillion. Balanced/mixed
fund assets increased 4.9% to €7.7 trillion and
money market fund assets decreased 1.0% to
€4.8 trillion.
41% of worldwide regulated open-ended fund
net assets were held in equity funds. The net
asset share of bond funds was 21% and the net
asset share of balanced/mixed funds was 18%
(unchanged). Money market fund net assets
represented 11% of the worldwide total.
+4.6%
/Q4 2016
€605bn
€70bn
Publishing Director:
Eric Dérobert -
Editor:
Corinne Brand
+33 1 57 78 31 50 corinne.brand@caceis.com-
Design:
Sylvie Revest-Debeuré
Photos credit:
Notified on pictures -
Printer:
GRAPH’IMPRIM certified Imprim’vert®. This document is printed on Cyclus paper, 100% recycled fiber, certified Blaue Engel, Nordic Ecolabel and Ecolabel européen -
Number ISSN:
1952-6695. For further information on our products and services, please contact your Business Development Manager. This newsletter has been produced by CACEIS. CACEIS cannot be held responsible
for any inaccuracies or errors of interpretation, which this document may contain.
www.caceis.comFollow us
0
2000
4000
6000
8000
10000
12000
14000
16000
2017
2016
Q1
Q2
Q3
Q4
Q1
AIFs recorded net inflows of €70 billion during
Q2 2017, up from €42 billion in Q4 2016.
Country Focus - Luxembourg
Investment class distribution - Net Assets
May 2017
3,525 3,499 3,603 3,639 3,659 3,664 3,678 3,741 3,767 3,860 3,906 3,938 3,956
05 06 07 08 09
2016
2017
10 11 12 01 02 03 04 05
818
685
569
537
339 338
168
92 84 79
249
US GB DE CH IT FR BE
LU NL
DK Others
Net assets under management (AuM)
in Luxembourg funds (€ trillion) - May 2017
Source CSSF/ALFI
€3.96 trillion: net assets
under management in
Luxembourg investment
funds at the close of
May 2017. This represents
an increase of 12.22% in
comparison with end May
2016.
€3.96tr
+12.22%
/May 2016
20.7%
US Market share:
At the close of May
2017, in terms of net
assets, US promoters
held on to the first
place with a market
share of 21%.
Market shares of fund promoters by country of origin
May 2017
Source CSSF
Source CSSF
€1,55trn
Fixed Income
Bond
8.4%
6.1%
1.4%
1.8%
1.6%
30.1%
29.2%
27.5%
€3.96tr
Equity
Balanced
Money Market & Cash
Funds of funds
Real Estate
PE/Venture capital
Other
€1,189bn
€1,156bn
€851bn
€331bn
€242bn
€54bn
€72bn
€61bn
2015
2016
2017
32
48
48 47
43 42
62
70
56
© yarchyk - Fotolia