


 3 / 10

14
A
vula
et al
.
:
J
ournal of
AOAC I
nternational
V
ol
. 98, N
o
. 1, 2015
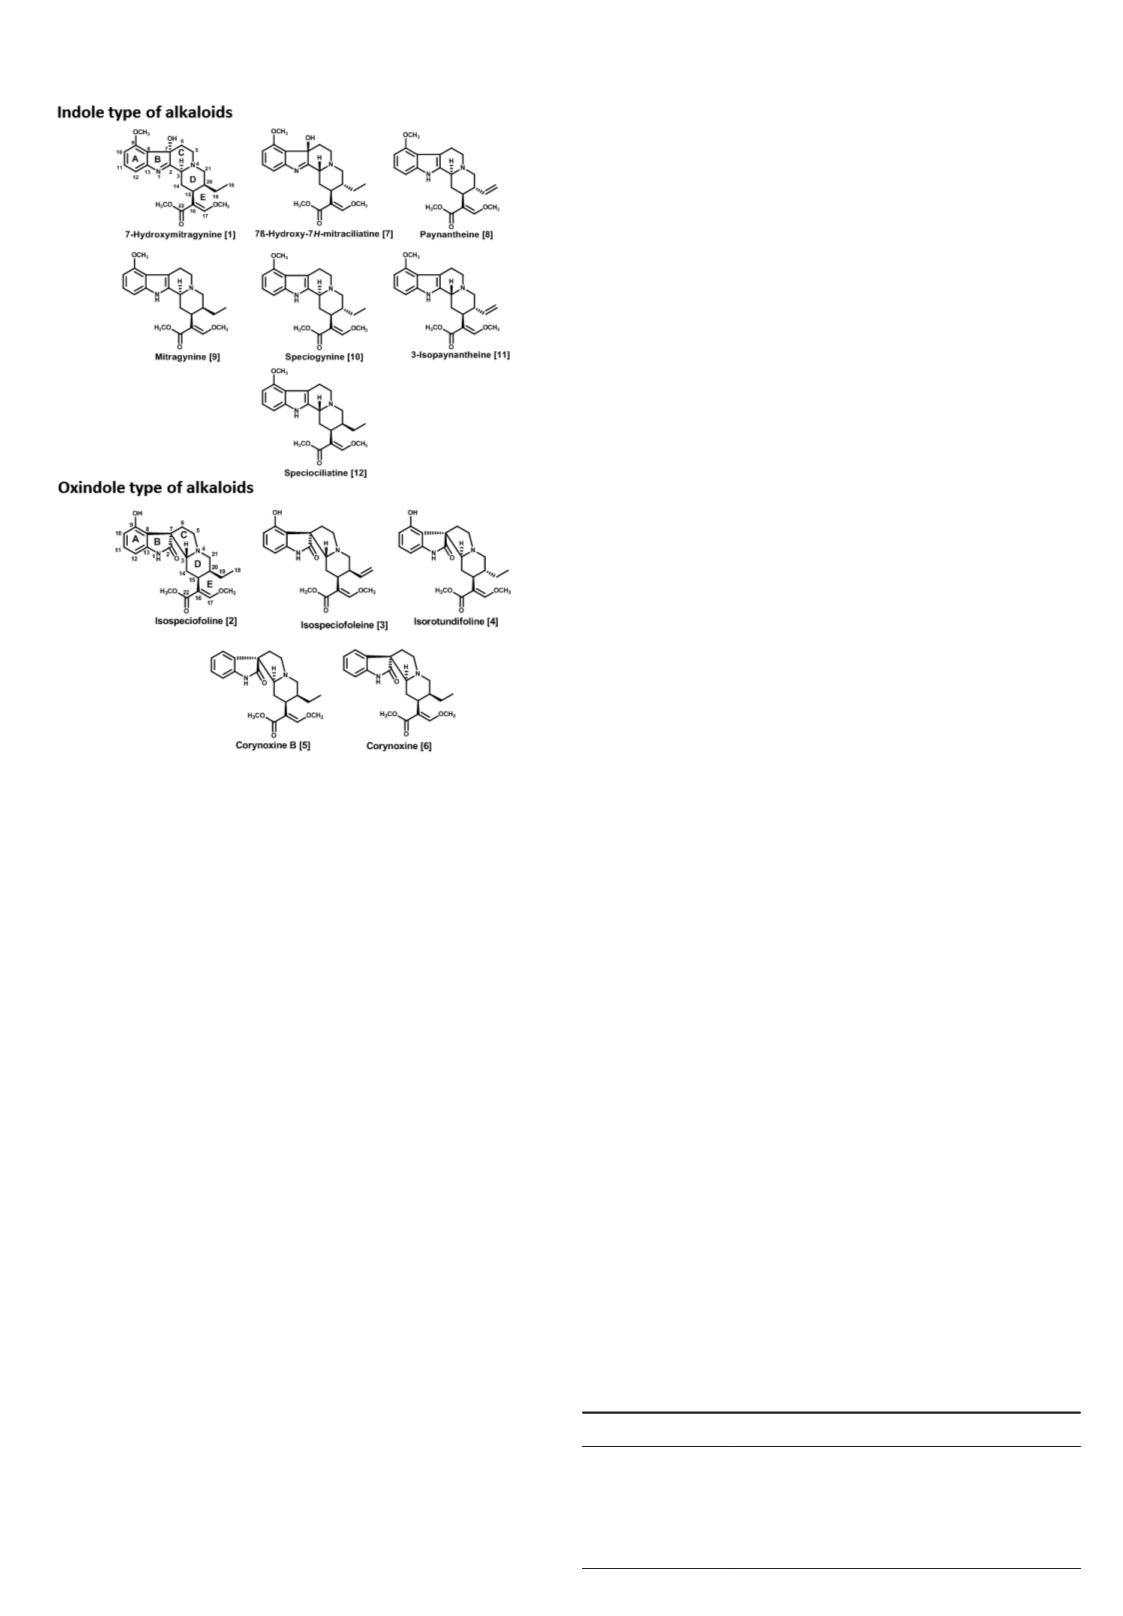
for detailed structural analysis of alkaloids. This paper describes
a method to resolve and characterize 12 indole and oxindole
diastereomer alkaloids. The instrumentation consists of an
ultra-HPLC (UHPLC) system coupled with a QToF mass
spectrometer that can be used for chemical fingerprinting
analysis of
M. speciosa
and is also suitable for the QC of
various commercial samples. The fragmentation patterns for
7-hydroxymitragynine [
1
], isospeciofoline [
2
], isospeciofoleine
[
3
], isorotundifoline [
4
], corynoxine B [
5
], corynoxine
[
6
], 7β-hydroxy-7
H
-mitraciliatine [
7
], paynantheine [
8
],
mitragynine [
9
], speciogynine [
10
], 3-isopaynantheine [
11
],
and speciociliatine [
12
] were studied with proposed structures
(Figure 1) for each significant product ion. With this
characterization and chromatographic optimization, alkaloidal
mixtures containing a large number of diastereoisomers were
separated in extracts of
M. speciosa
leaves. The method offered
more information about the chemical constituents of
M. speciosa
with the diastereomeric alkaloids identified and characterized
according to retention times (RTs) and mass spectra.
Experimental
UHPLC/QToF-MS Instrumentation and Conditions
The UHPLC system was an Agilent Technologies (Santa
Clara, CA) Series 1290 comprising the following modular
components: a binary pump, vacuum solvent microdegasser,
autosampler with 100-well tray, and thermostatically controlled
column compartment. Separation was achieved on an Agilent
Zorbax SB-octylsilyl (C8) RRHD column (2.1×100 mm,
1.8 µm). The mobile phase consisted of water with 0.1% formic
acid (A) and acetonitrile with 0.1% formic acid (B) at a flow
rate of 0.23 mL/min, with the gradient elution program as given
in Table 1.
Each run was followed by a 5 min wash with 100% B and
an equilibration period of 5 min with 85% A/15% B. A 2 μL
volume of sample was injected. The column temperature
was 35
°
C. The mass spectrometric analysis was performed
with a hybrid QToF mass spectrometer (Model No. G6530A,
Agilent Technologies) equipped with an ESI source with Jet
Stream technology using the following parameters: drying
gas (N
2
) flow rate, 9.0 L/min; drying gas temperature, 250
°
C;
nebulizer, 35 psig; sheath gas temperature, 325
°
C; sheath
gas flow, 10
L/min; capillary, 3500 V; skimmer, 65 V; Oct
radio frequency (RF) V, 750 V; and fragmentor, 125 V. All
operations and acquisition and analysis of data were controlled
by Agilent MassHunter Acquisition software version A.05.00
and processed with MassHunter Qualitative Analysis software
Version B.06.00. Each sample was analyzed in the positive
ion mode over the range of
m/z
= 100–1100 and extended
dynamic range (flight time to
m/z
1700 at 2 GHz acquisition
rate). Accurate mass measurements were obtained by means of
reference ion correction using reference masses at
m/z
121.0509
(protonated purine) and 922.0098 [protonated hexakis (1
H
, 1
H
,
3
H
-tetrafluoropropoxy) phosphazine or HP-921] in the positive
ion mode, while
m/z
112.9856 [deprotonated trifluoroacetic
acid (TFA)] and 1033.9881 (TFA adducted HP-921) were used
in the negative ion mode. The compounds were confirmed in
each spectrum. For this purpose, the reference solution was
introduced into the ESI source via a T-junction using an Agilent
Series 1200 isocratic pump and a 100:1 splitter set at a flow rate
of 20 µL/min.
For recording ToF mass spectra, the quadrupole was set to
pass all ions (RF only mode), and all ions were transmitted
into the pusher region of the ToF analyzer where they were
mass analyzed with a 1 s integration time. For the ESI-MS/MS
collision induced dissociation (CID) experiments, precursor
ions of interest were mass selected by the quadrupole mass
filter. The selected ions were then subjected to collision with
nitrogen in a high pressure collision cell. The collision energy
was optimized to afford good product ion signals, which
were subsequently analyzed with the ToF mass spectrometer.
Analysis was performed in the reflectron mode with a resolving
power of about 10,000 at
m/z
922. The instrument was set to
the extended dynamic range (up to 10
5
with lower resolving
power). MS/MS spectra were recorded simultaneously at a
rate of 2.0 spectra/s. In order to filter selected precursor ions
and their isotopes for MS/MS, an isolation window of 1.3
m/z
was set for the quadrupole. MS/MS studies were performed by
isolating [M+H]
+
ions. The fragmentation pattern was obtained
Table 1. Mobile phase gradient elution program
Time, min
A, %
B, %
0.00
85
15
20.00
65
35
30.00
0
100
35.00
0
100
Figure 1. Structures of reference compounds.