


 11 / 40

11
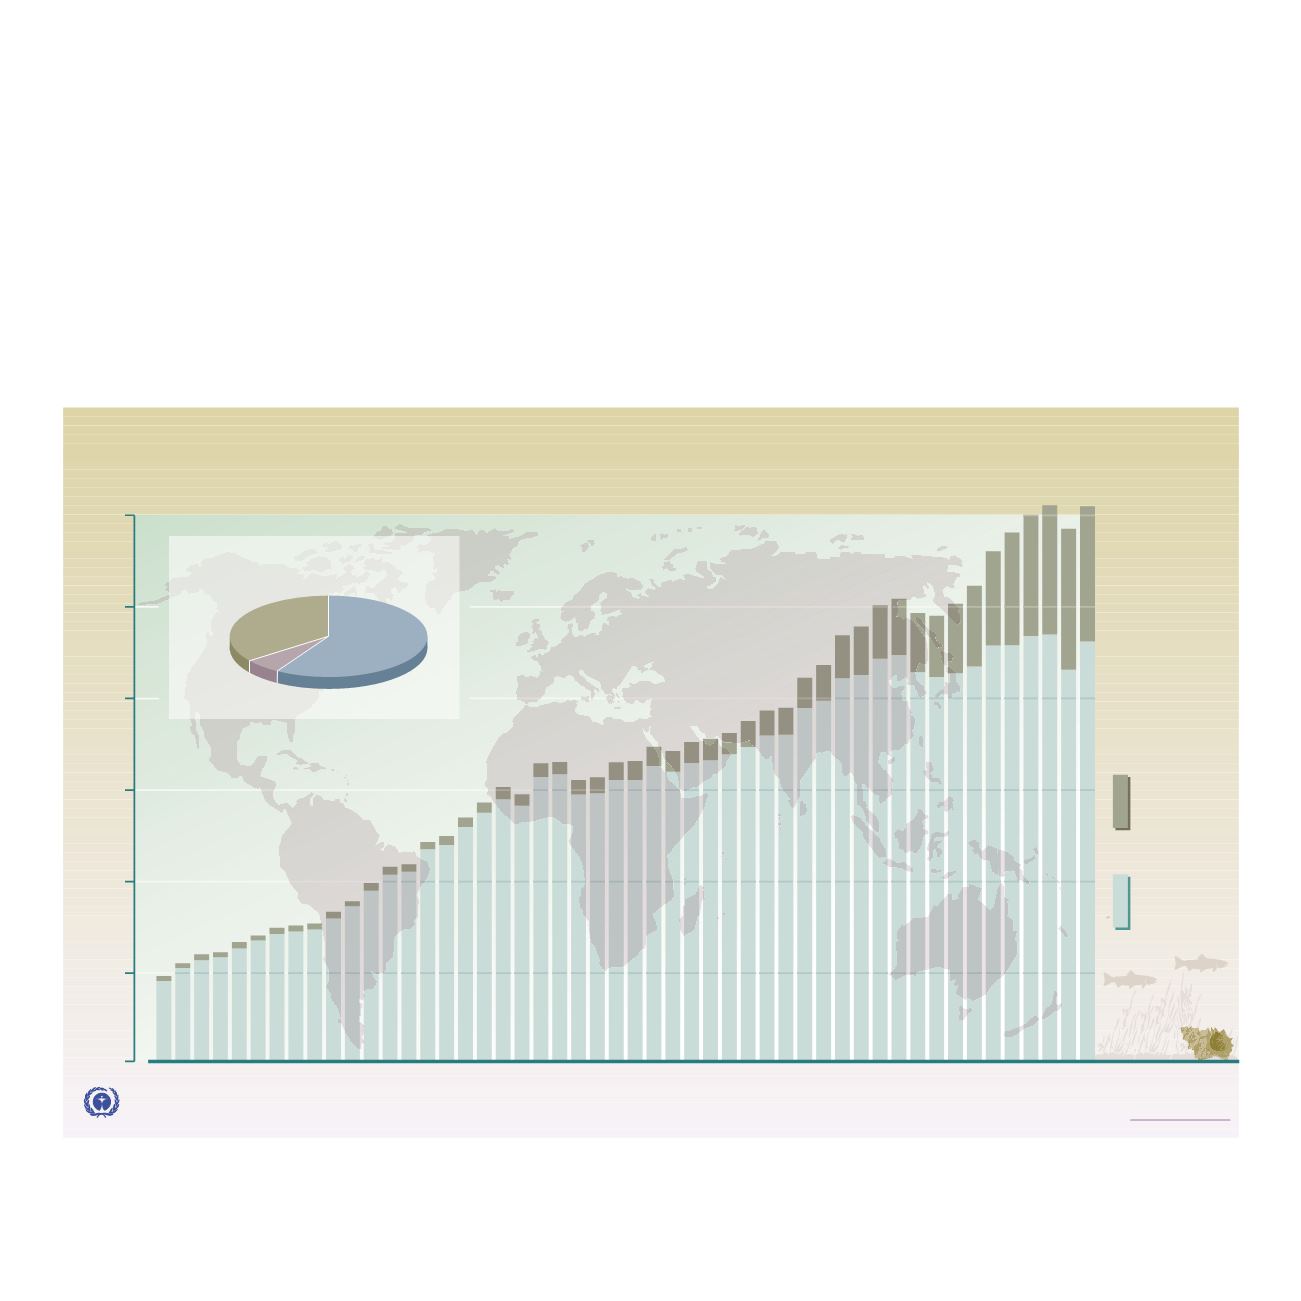
Figure 3. World fisheries and aquaculture production.
Shows the
amount, in million tonnes, of fish taken by capture and aquaculture
����
����
����
����
����
����
����
����
����
���� ����
�
��
��
��
��
���
���
�������������
�������������������
��������������������������������������������������������������
�������������������
�����������
�������
���������
����
��������
�������������������������������������������������
����������������������������������������������������������������
�����������
�������
������������
�������
��������
�����
������
������������������������������
���
���
��
fisheries, between the years 1950-1999. Also included is a diagram
showing the percentage of the different types of aquaculture in 1998.