


 52 / 72


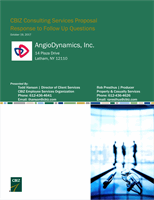
Illustrative 3-Year Health Benefit Strategic Plan Financial Summary
Financial Summary Results
2017
2018
2019
2020
Total Annual Funding Cost $36,552,000 $35,154,893 $32,876,061 $32,319,119
Total Annual Employee Contribution $1,827,600 $5,273,234 $7,397,114 $9,695,736
Total Annual Employer Contribution $34,724,400 $29,881,659 $25,478,947 $22,623,383
2017
2018
2019
2020
Total
Total Funding Cost Increase
N/A
-3.8%
-6.5%
-1.7% -11.6%
Total Employee Contrib Increase
N/A
188.5%
40.3%
31.1% 430.5%
Total Employer Contrib Increase
N/A
-13.9%
-14.7%
-11.2% -34.8%
Cost Control Strategies To Consider
●
●
●
●
●
●
●
Plan Design Changes (e.g. HSA plans, etc)
Rx Formulary Optimization & Modeling
Detailed Contribution Modeling
Below is the data table for the above graph.
Below are some of the innovative cost control strategies to consider. Each of these strategies has its own detailed feasibility
study to determine the respective projected financial discounts.
Pure Stop Loss Captive
See the next section for the financial details of each annual projection.
On-Site Clinic
Narrow Network/ACO Network
Actuarial Stop Loss Modeling
Below is an illustration of the forecasted results of the 3-Year Strategic Plan. Each year includes several innovative strategies
to control costs.
$0
$5,000,000
$10,000,000
$15,000,000
$20,000,000
$25,000,000
$30,000,000
$35,000,000
$40,000,000
2017
2018
2019
2020
Health Benefit Cost 3-Year Illustrative Forecast
Total Annual Funding Cost
Total Annual Employee Contribution
Total Annual Employer Contribution
5