


 9 / 12

Page | 3
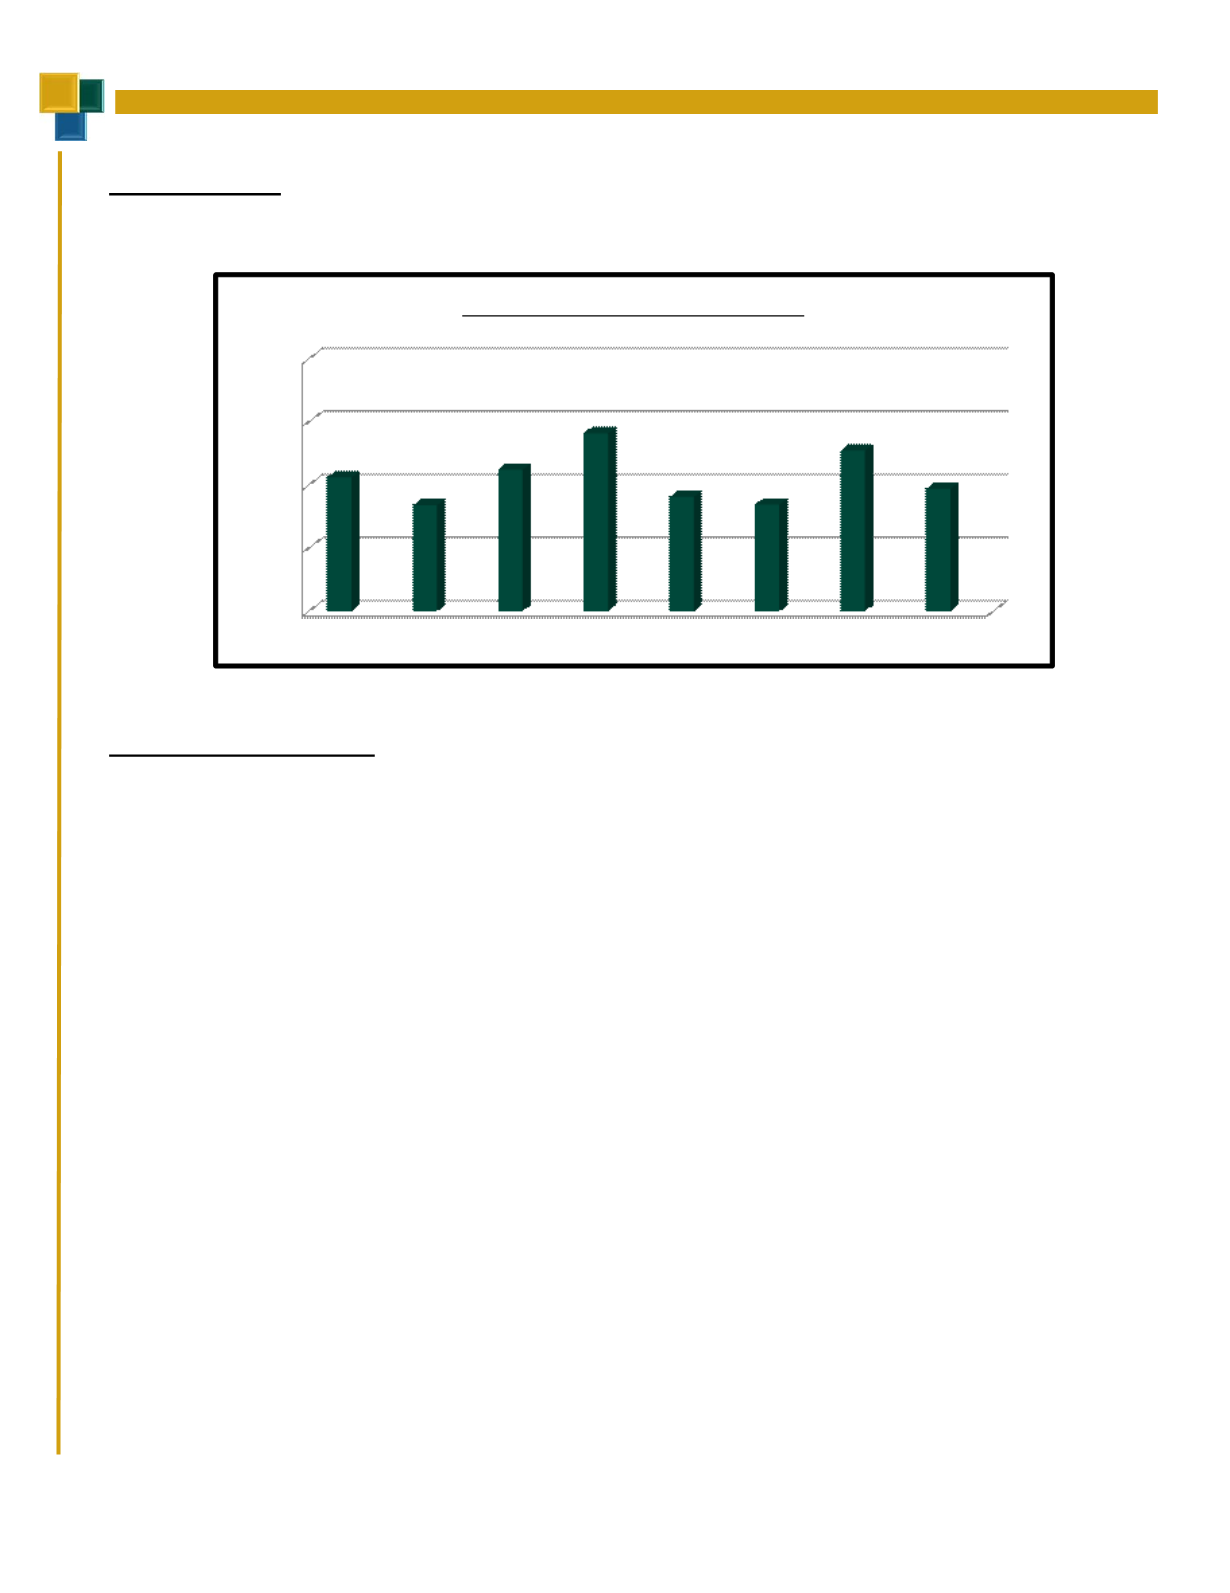
Claims by Month
Chart 2 below shows gross claims PMPM by month for the current period.
$0
$200
$400
$600
$800
Mar‐14 Apr‐14 May‐14 Jun‐14 Jul‐14 Aug‐14 Sep‐14 Oct‐14
$425
$337
$450
$565
$363
$339
$510
$389
Chart 2: Claims PMPM by Month
Claimant Size Distribution
There were 561 claimants in the current period. Three of these claimants have exceeded the $85,000 SSL
threshold:
$279,417 — End stage renal disease (Termed)
$128,504 — Regional enteritis
$94,989 — Radiotherapy (Termed; Cobra?)
A total of eight claimants exceeded $50,000 in the current period. Similarly, nine claimants exceeded
$50,000 in the prior period. Please see Appendix for additional details on the high cost claimants.
Chart 3 on the following page shows the percentage of total claimants (green bar) and percentage of total
claims (gold bar) for specified claimant size ranges. For example, the eight claimants exceeding $50,000
represent 1.4% of the 561 claimants and 37.9% of the total claims cost.