


 5 / 16

5
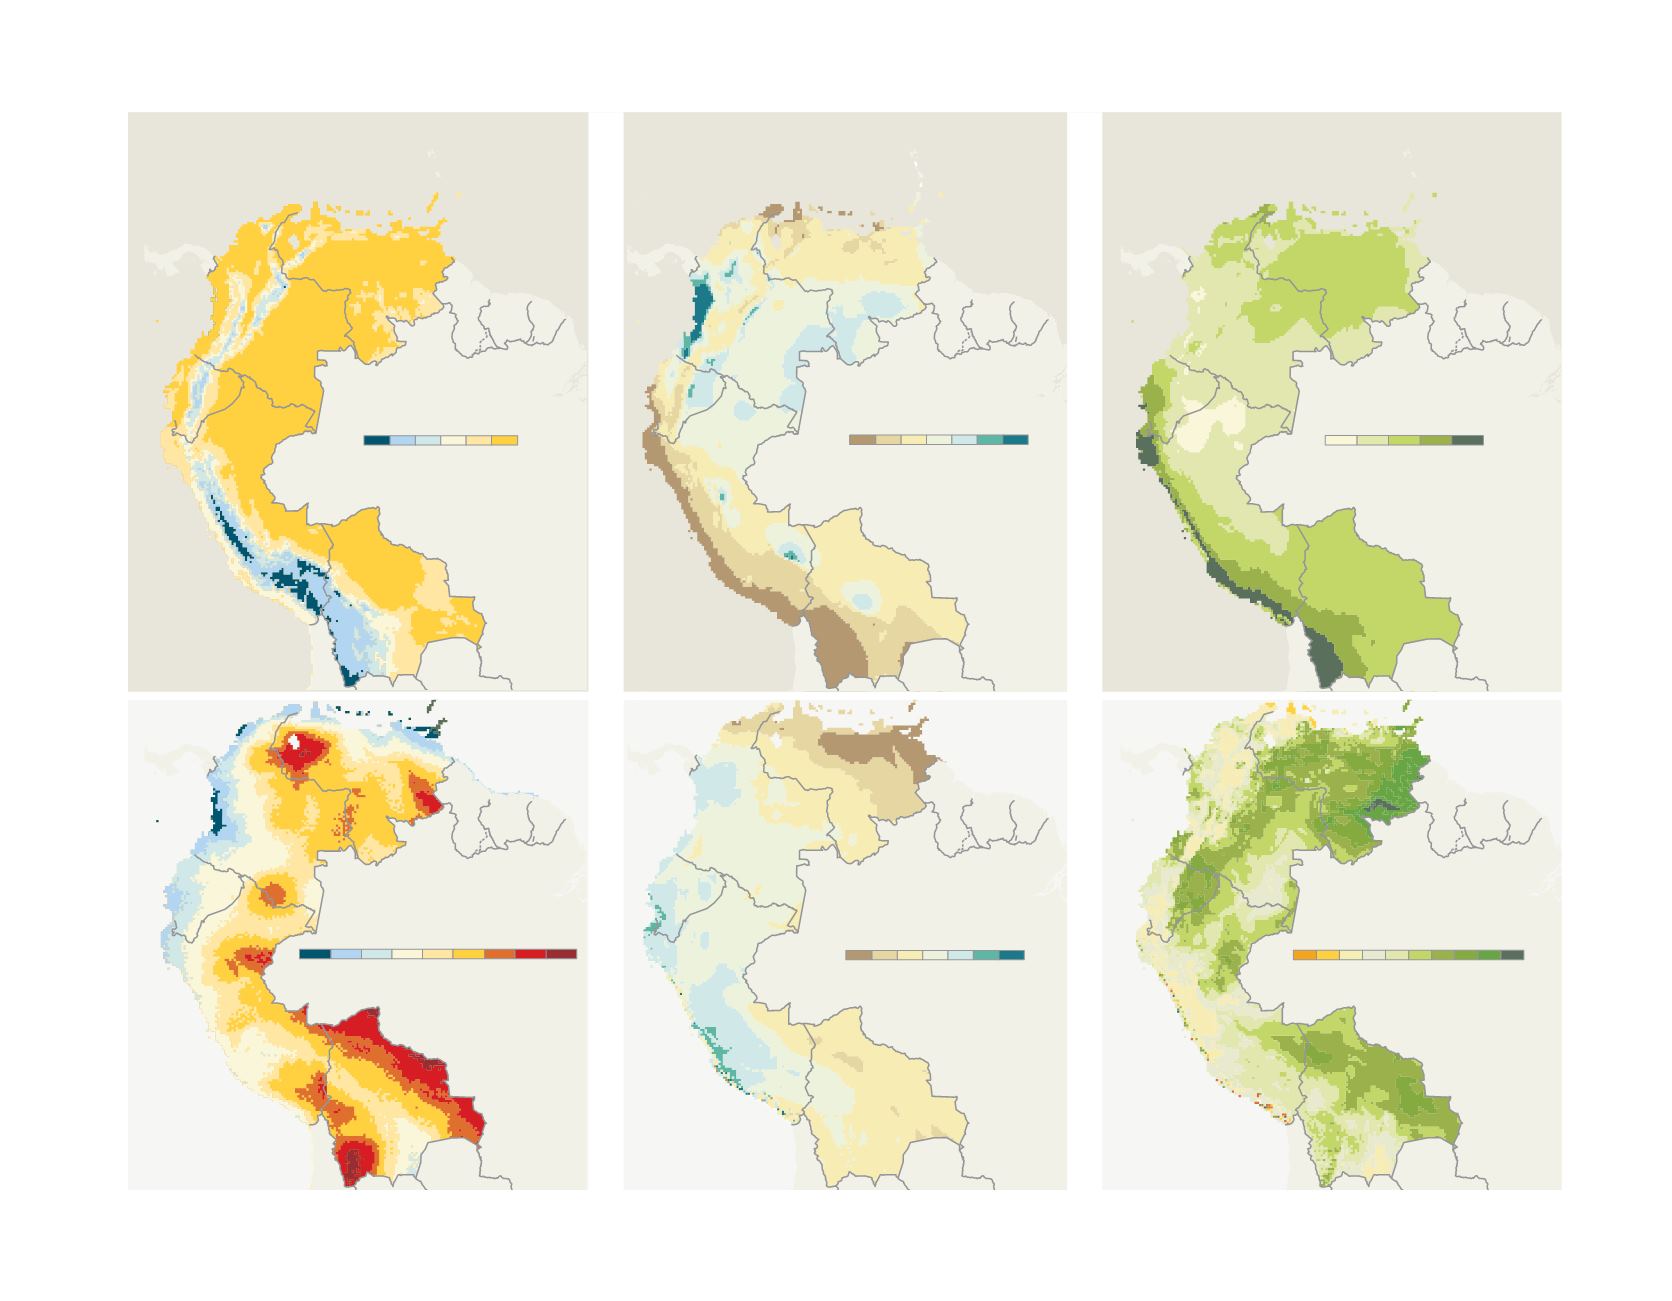
Projected seasonality* change**
Percentage points
*Precipitation of the
wettest consecutive
three months divided by
annual precipitation
PERU
ECUADOR
COLOMBIA
VENEZUELA
BOLIVIA
PERU
ECUADOR
COLOMBIA
VENEZUELA
BOLIVIA
PERU
ECUADOR
COLOMBIA
VENEZUELA
BOLIVIA
PERU
ECUADOR
COLOMBIA
VENEZUELA
BOLIVIA
PERU
ECUADOR
COLOMBIA
VENEZUELA
BOLIVIA
PERU
ECUADOR
COLOMBIA
VENEZUELA
BOLIVIA
0 -10 -20 -40
10 20 40
Percentage
Seasonality*
Percentage
2.5
3.0 3.5
4.0
˚C
0
500
1000
2000 4000
3000 5000
Millimetres
0 5 10 15 20 25 30
˚C
Annual temperature distribution
Annual rainfall distribution
30 0
40 60 80 100
-10 0 -5 1 2 3 4 5 7
Sources:
worldclim.org. Maps have
been produced within the SMD4GC
program at UZH (Switzerland)
Projection for
2061-2080
RCP 8.5
Projection for
2061-2080
RCP 8.5
Projection for
2061-2080
RCP 8.5
1950-2000
1950-2000
1950-2000
*Climate models
agree well on
direction of change
*Agreement
between climate
models can be low
*Agreement
between climate
models can be low
Climate change in the Tropical Andes
Projected precipitation change
Projected temperature change*