


 1140 / 1674

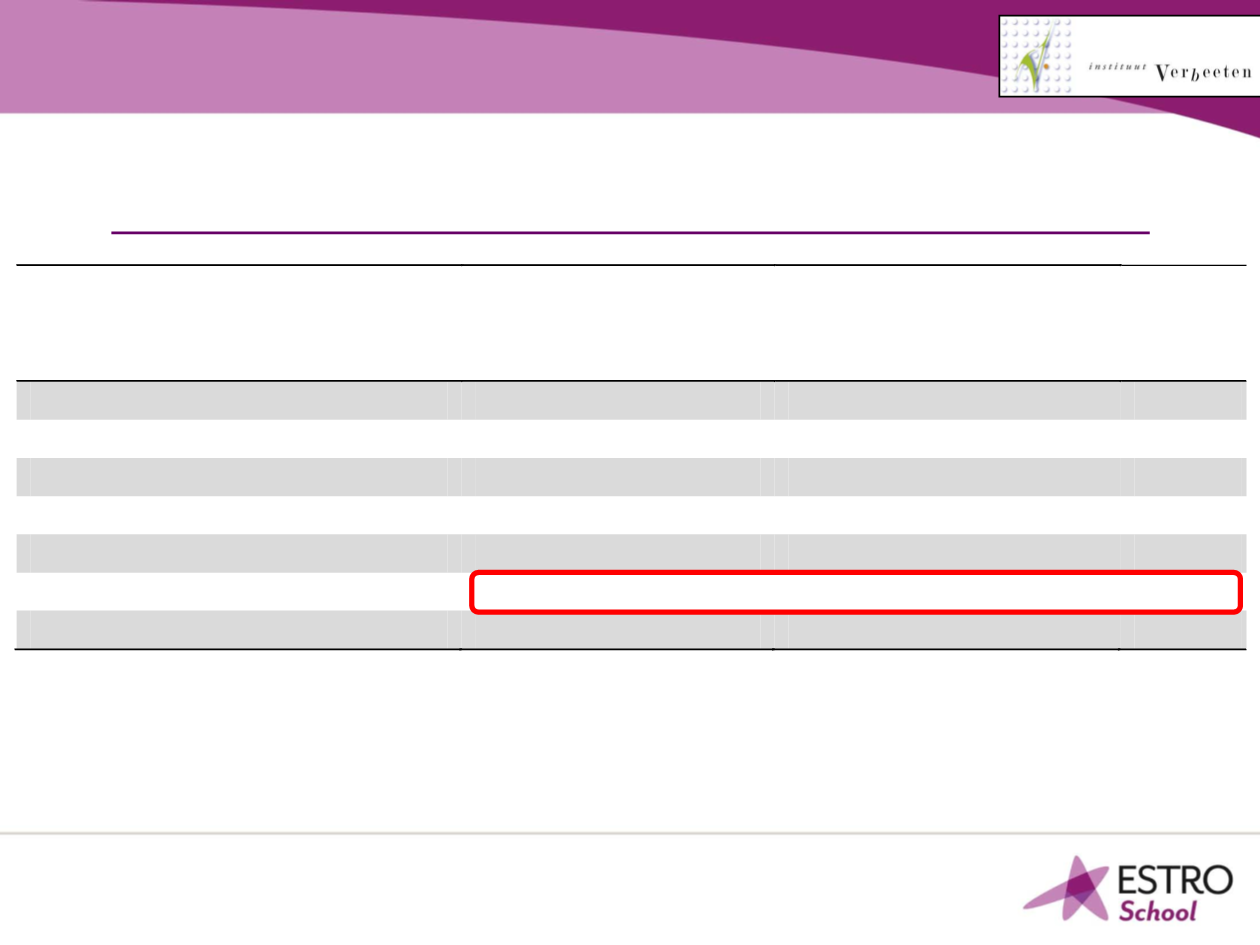
Score (SD)
Conventional
fractioning
(n=15)
Hypofractionation
(n=18)
P
value
BCCT.core score
2.45 (0.52)
2.25 (0.62)
0.4
YBT
26.94 (15.03)
29.2 (18.5)
0.71
C30Functioning scale
75.90 (22.57)
86.91 (22.18)
0.19
C30Symptom scale
17.31 (10.22)
17.97 (12.85)
0.88
C30QOL
63.45 (35.77
75.00 (22.24)
0.29
BR23Functioningscale
70.19 (16.30)
84.72 (16.91)
0.02
BR23Symptom scale
20.51 (12.35)
17.06 (13.30)
0.46
Oncoplastic surgery &
RT: outcome
Results conventional vs hypofractionation
The patients in this comparison had oncoplastic surgery
Lansu JT, et al. Eur J Surg Oncol. 2015;41:1411-6.