


 7 / 24

7
UC Merced Office of Admissions
UC MERCED
SNAPSHOT
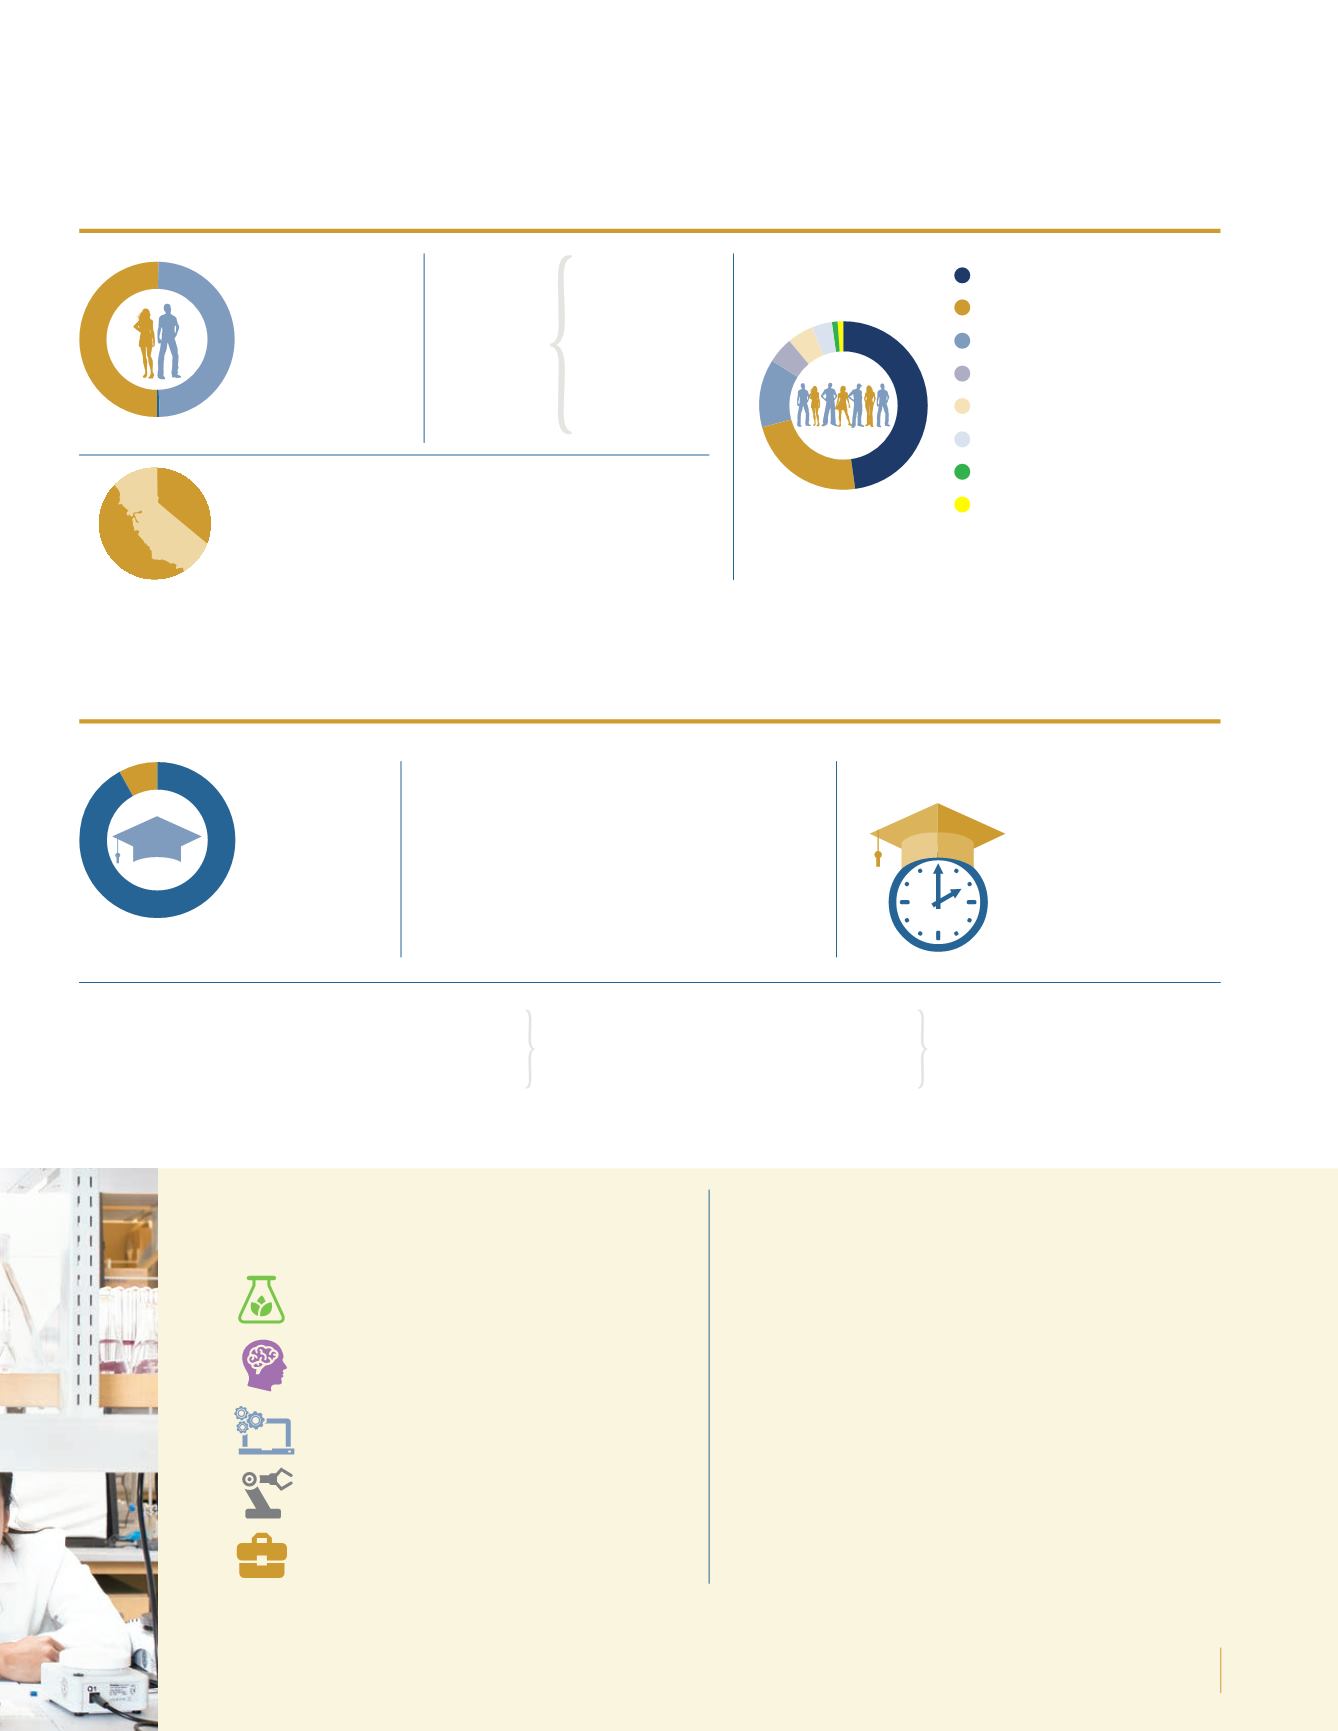
STUDENT BODY PROFILE 2016
UNDERGRADUATE PROFILE 2016
6,815
Undergraduate
Students
521
Graduate
Students
50.5%
Female
71%
All Undergraduates
85.8%
First-Time Freshmen
2,550
School of Social Sciences, Humanities and Arts
1,981
School of Natural Sciences
1,698
School of Engineering
586
Undeclared
85.5%
First Generation
88.5%
First Generation
91.6%
Transfers
4.5 YEARS
First-Time Freshmen
92.2%
First Year
49%
Male
76.4%
First Year
2.75 YEARS
Transfers
7.8%
Transfer
0.5%
Declined to State
68.2%
New Transfer
99%
of students are from California
Chicano/Latino
48%
Asian
23%
White
13%
African-American
5%
Nonresident alien
5%
Two or more races
4%
Pacific Islander
1%
Unknown/
1%
Declined to state
7,336
Campus
Enrollment
First
Generation
Status
*
Average Time to Degree
*
Retention Rate
*
MOST POPULAR
UNDERGRADUATE MAJORS
UNDERGRADUATE ENROLLMENT
BY SCHOOL
*First Generation is
defined as neither parent
having a 4-year college
degree.
*2015-16 graduates
*Fall 2015 students who
returned for fall 2016
PLEASE NOTE:
PERCENTAGES MAY NOT TOTAL 100% DUE TO ROUNDING.
SOURCE: UC MERCED INSTITUTIONAL RESEARCH AND DECISION SUPPORT DIVISION, FALL 2016Biological Sciences
Psychology
Computer Science and Engineering
Mechanical Engineering
Management and Business Economics