


 29 / 74

29
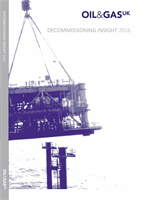
Figure 16: Combined Topside Removal Forecast for the UK and Norwegian Continental Shelves
0
20,000
40,000
60,000
80,000
100,000
120,000
140,000
2016 2017 2018 2019 2020 2021 2022 2023 2024 2025
Tonnes to be Removed
Southern North Sea and Irish Sea
Northern North Sea and West of Shetland
Central North Sea
Norwegian Continental Shelf
Source: Oil & Gas UK
Increased Uncertainty
in Forecasts
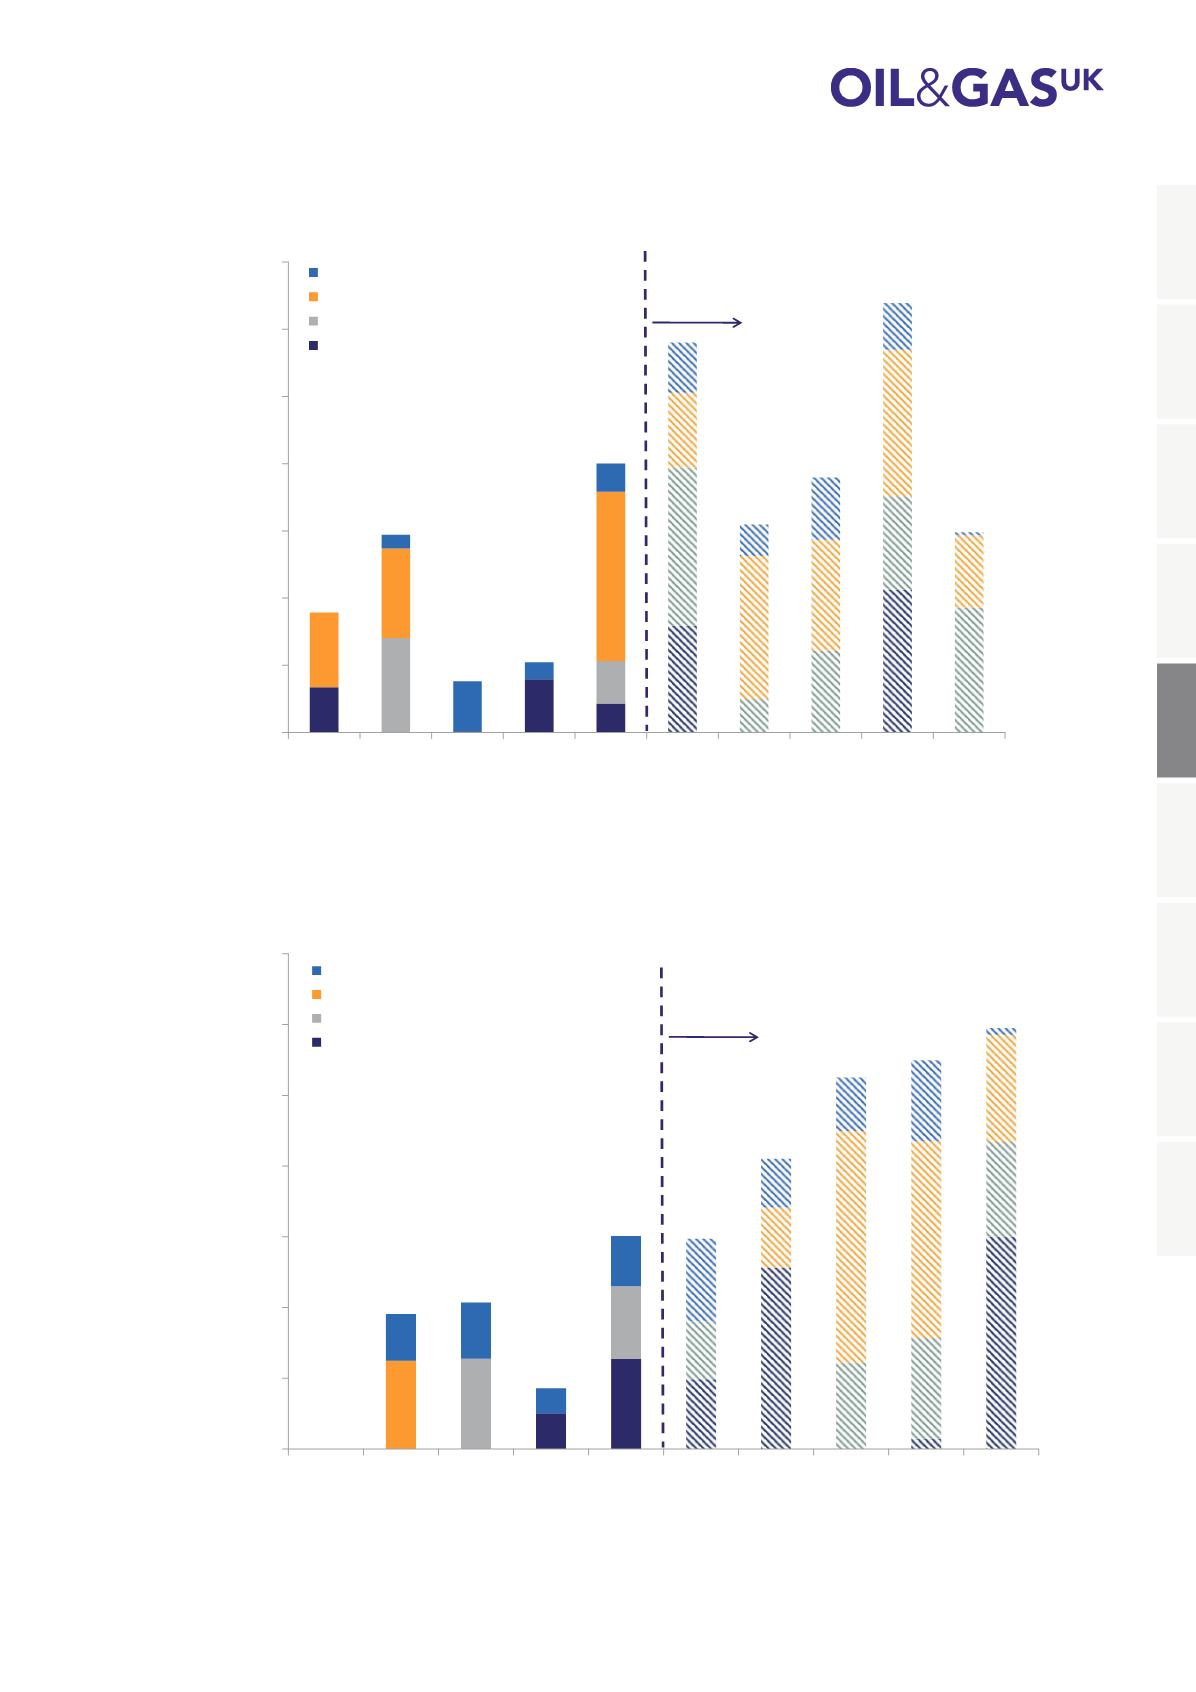
Figure 17: Combined Substructure Removal Forecast for the UK and Norwegian Continental Shelves
0
10,000
20,000
30,000
40,000
50,000
60,000
70,000
2016 2017 2018 2019 2020 2021 2022 2023 2024 2025
Tonnes to be Removed
Southern North Sea and Irish Sea
Northern North Sea and West of Shetland
Central North Sea
Norwegian Continental Shelf
Source: Oil & Gas UK
Increased Uncertainty
in Forecasts
1
2
3
4
5
6
7
8
9