


 13 / 24


1130
C
onklin
et al
.:
J
ournal of
aoaC i
nternational
V
ol
.
99, n
o
.
4, 2016
(h)
Create/edit the sequence file on the ICP–MS data system.
Ensure that the injection list and HPLC method on the HPLC
controller match the ICP–MS sequence.
(i)
Analyze calibration standards, MBKs, check solutions,
sample extracts, FAPs, CRMs, and any other QC samples.
A typical analytical batch is shown in Table
2016.04D
. Check
RTs, peak shape and response of both IS and arsenic species in
the
m/z
75 chromatograms. Typical RTs are as follows: As(III)
= 2.9 ± 0.2 min, DMA = 3.9 ± 0.2 min, MMA = 5.5 ± 0.3 min,
and As(V) = 12.7 ± 0.5 min. To some extent, the RTs and peak
shapes are dependent on the age and performance of the LC
column [especially the As(V) peak]. However, significant (>7%)
between the RT of the standards and samples (including spiked
samples) within the same batch are not anticipated and should
be investigated and corrected if noted.—(
1
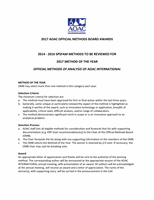
) Figure
2016.04B
shows example chromatograms obtained for the resolution
check solution, a 5 ng/g standard, and an apple juice sample.
(
2
) Check the
m/z
77 chromatograms of samples for
indications of possible argon chloride (
40
Ar
35
Cl
+
at
m/z
75 and
40
Ar
37
Cl
+
at
m/z
77) interferences in the
m/z
75 chromatograms.
Peaks detected in the
m/z
77 chromatograms arising from
40
Ar
37
Cl
+
will also have peaks with matching RTs in the
m/z
75
chromatograms. However, analysts should be aware that peaks
may also be present in the
m/z
77 chromatograms without
corresponding peaks at
m/z
75, as a result of, for example,
selenium species (
77
Se
+
).
(j)
Integrate
m/z
75 chromatograms.—(
1
) The settings in
Table
2016.04E
are suggested integration parameters for
m/z
75
and provide a recommended starting point for integration; these
parameters are specific to Agilent MassHunter data analysis
software. All chromatograms should be visually inspected and
manually integrated when necessary to ensure consistency and
accuracy of integration. It is important to verify that peaks are
properly
identified by the integrator, and it is imperative that
manual integrations be as consistent as possible, especially
within the same analytical batch.
(
2
) After the settings are verified as correct, choose “Apply
to All.” This will apply these integration parameters to the IS,
As(III), As(V), DMA, and MMA peaks.
(
3
) To eliminate peaks in the
m/z
77 trace from being
integrated (resulting in extended processing time), increase the
minimum peak area counts for m/z 77 to ≥10,000.
(
4
) The S/N for questionable chromatographic peaks can
be calculated using MassHunter software. Autointegrate the
questionable peak and verify proper integration. Manually
adjust the integration if necessary. Select the “Set Noise
Region” icon and the appropriate noise region near the peak of
interest in the lower chromatogram. Ensure that the “S/N Ratio”
option in the bottom window is checked under the “Show Peak
Labels” dialog box, then reprocess the data. Questionable peaks
must have an S/N > 3:1 to be considered detected. Questionable
peaks with an S/N < 3:1 will be treated as nondetected.
(
5
)
Unknown peaks
.—(
a
) If unknown peaks are detected
with a S/N > 3:1, they should be added to the analyte list (in the
Data Analysis Method Editor) and named “Unk X” (where “X”
is the approximate RT). Unknown peaks are defined as peaks
that do not match the expected RTs (as described previously) of
As(III), As(V), DMA, or MMA.
(
b
) These peaks can be integrated using the above parameters,
but care should be taken to ensure that unknown peaks are not
integrated as known peaks and vice-versa.
Figure 2016.04B. Example HPLC–ICP–MS chromatograms. (A)
Resolution check solution [5 ng/g AsB and As(III)]. (B) Multianalyte
standard [5 ng/g each of As(III), DMA, MMA, and As(V)]. (C) Apple
juice. IS = internal standard peak.
Table 2016.04D. Typical analytical batch sequence and QC
criteria
Solution
Purpose
QC criteria
DIW blank
Verify clean autosampler
vials
≤ASDL
Resolution
check solution
Check separation between
unretained species
(represented by AsB)
and As(III)
Near-baseline
separation
Multianalyte calibrations
standards
Standardize instrument
r
2
> 0.99
MBK 1
Verify absence of
contamination
≤ASDL
NIST SRM 1643e
Demonstrate accuracy
80–120%
recovery
Ten analytical solutions
(includes replicates
and FAPs)
Determine As species
concn
Within calibration
range, RSD ≤ 15%
Calibration check
standard
Verify standardization
85–115% of
expected
MBK 2
Verify absence of
contamination
≤ASDL
Ten analytical solutions
(includes replicates and
FAPs)
Determine As species
concn
Within calibration
range, RSD ≤ 15%
Calibration check
standard
Verify standardization
85–115% of
expected
13