


 6 / 24


4
E
bersole
et al
.:
J
ournal of
AOAC I
nternational
V
ol
.
100, N
o
.
3, 2017
included the analytical range of 0.1–2.8% ABV required by
SMPR 2016.001 for kombucha products.
LOD and LOQ
The results from the 12 independent analyses showed that
the MDL was 0.003% ABV and that the LOQ of the method
was 0.01%ABV, which is lower than the LOQ value of ≤0.05%
ABV specified in SMPR 2016.001 (Table 1).
Precision
Results of the precision evaluation for the six samples are
summarized in Table 2.
The overall RSD
r
values ranged from 1.62 to 2.21%, which
are within the AOAC range for the sample concentration (20)
and the SMPR limit of ≤4% (Table 1). The HorRat values,
which ranged from 0.4 to 0.6 for all the samples, are within the
AOAC guideline of 0.5–2.0 (20).
Accuracy
Results of the spike recovery study are summarized in Table 3.
The mean recovery for each of the three levels tested was found
to be 99.6, 100.4, and 100.4%. The lowest recovery (96.2%)
was found in the low-level ethanol-spiked kombucha sample on
day 3. Table 4 shows the accuracy of the method for analyzing the
certified ethanol reference standard,
F(d)
. The average recovery
over 2 days was 98.2% ABV. Overall, the results from the
recovery assessments are within AOAC guidelines and meet the
requirements of AOAC SMPR 2016.001 for the determination
of ethanol in kombucha, which states that recovery should be
97–102% over the range of the assay (Table 1).
Conclusions
The method, validated following AOAC
Guidelines for
Single Laboratory Validation of Chemical Methods for Dietary
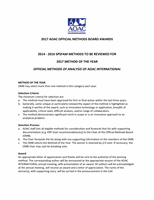
Figure 1. Gas chromatograms of commercial kombucha products and ethanol references. (A) Representative commercial kombucha sample;
(B) blank sample, G(h); (C) blank sample, G(h), spiked with ethanol standard solution at 3.30% ABV.
Table 2. Precision determinations for ethanol in kombucha
beverages
Kombucha sample
Mean, % ABV RSD
r
, % HorRat
Elderberry-flavored
2.18
2.14
0.6
Berry-flavored
0.11
2.21
0.4
Raspberry-flavored
2.22
1.62
0.5
Unflavored
1.56
1.67
0.5
Ginger-lemon-flavored
1.21
1.80
0.5
Apple-flavored
1.30
2.18
0.6
Table 3. Spike recovery of ethanol using matrix at three
different levels
a
Day
Low, % Medium, % High, %
1
98.3
99.7
99.9
99.9
99.5
99.1
2
99.7
99.5
98.4
100.4
99.6
99.2
3
103.2
100
102.5
96.2
104.2
103.4
Mean
99.6
100.4
100.4
a
Low = 0.13% ABV; medium = 1.30% ABV; and high = 3.3% ABV.
6