


 4 / 14

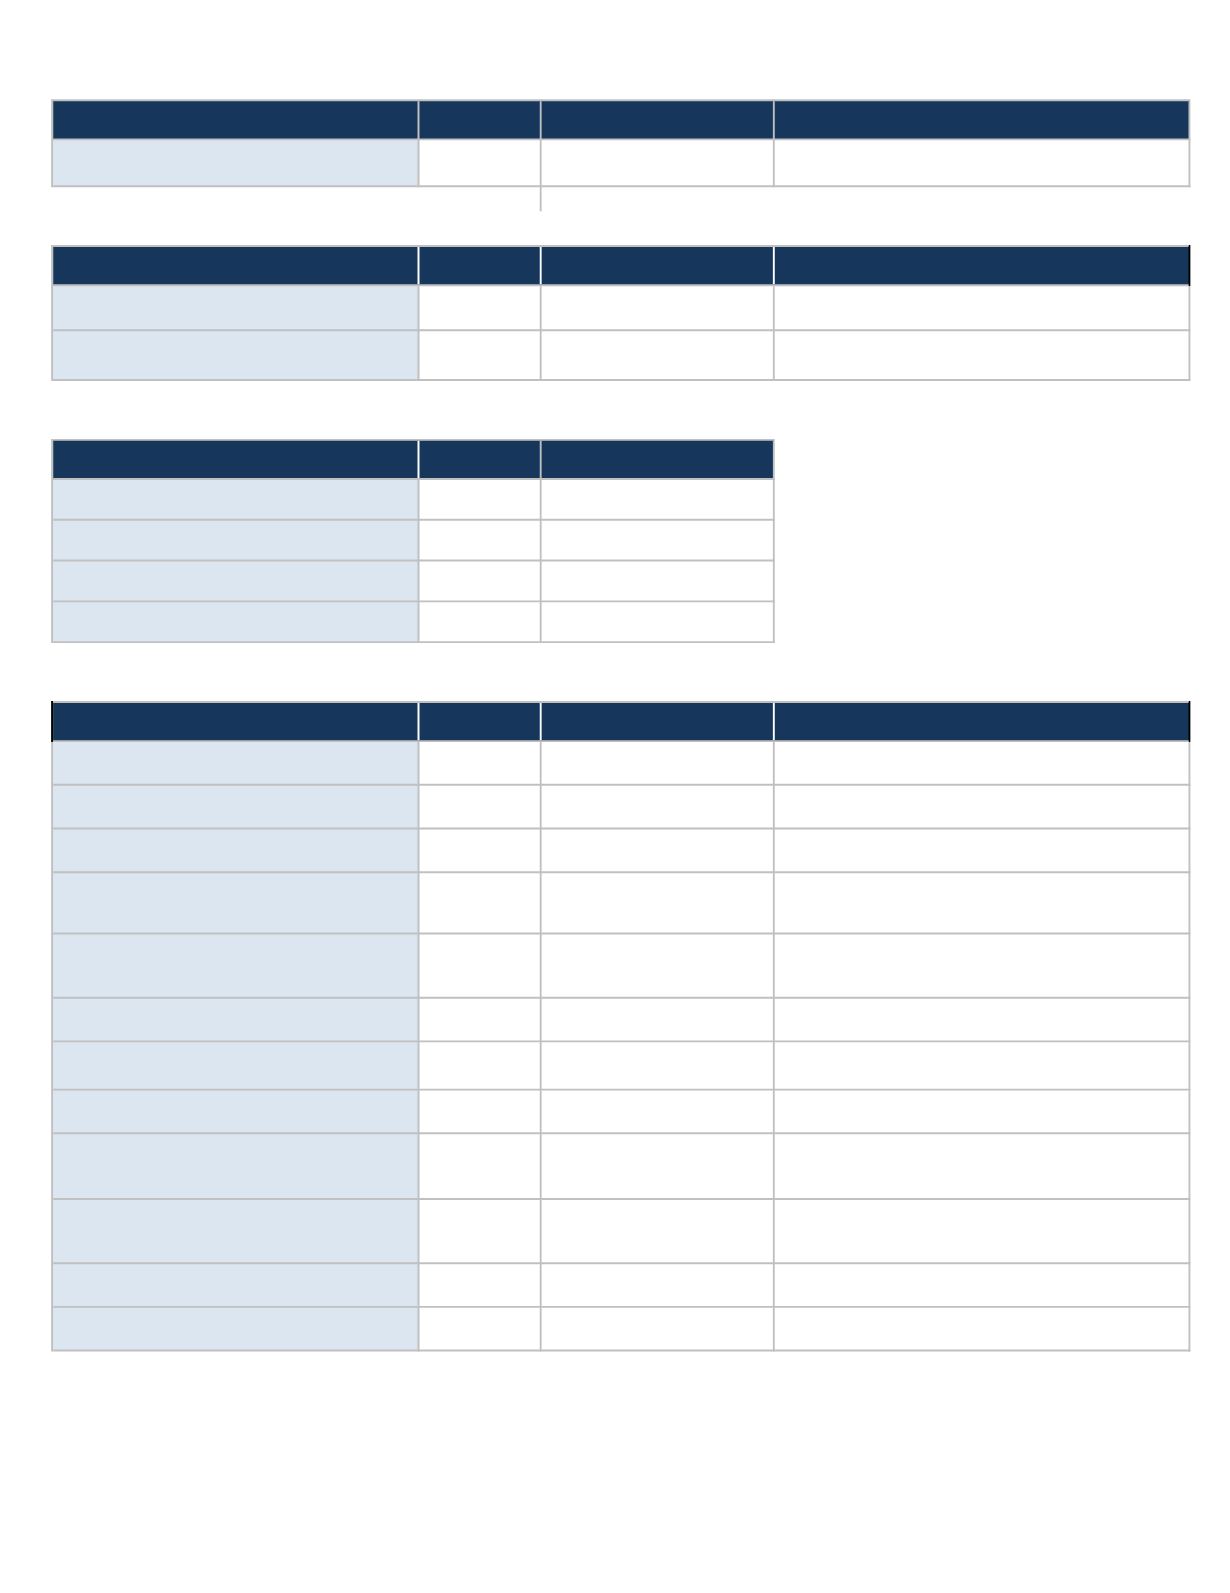
Turbidity (Combined Filter Effluent Turbidity Values)
Contaminant
Your water
MCL
Sources of Contaminant
Turbidity, NTU (Average)
0.06
TT = 1 NTU
Soil runoff
Nitrate and Nitrite
Contaminant
Your water
MCL
Sources of Contaminant
Nitrate, ppm
<1.0
10
Runoff from fertilizer use; leaching from septic tanks, sewage;
erosion of natural deposits
Nitrite, ppm
<0.1
1
Runoff from fertilizer use; leaching from septic tanks, sewage;
erosion of natural deposits
Minerals
Contaminant
Your water
MCL
Calcium, mg/l
5.93
N/A
Sodium, mg/l
27.8
N/A
Magnesium, mg/l
2.56
N/A
Potassium, mg/l
2.29
N/A
Inorganic Chemicals
Contaminant
Your water
MCL
Sources of Contaminant
Antimony, mg/l
<0.001
0.006
Discharge from petroleum refineries; fire retardants; ceramics;
electronics; solder
Arsenic, mg/l
<0.005
0.01
Erosion of natrual deposits; runoff from orchards, runoff from
glass & electronic production wastes
Barium, mg/l
<0.400
2
Discharge of drilling wastes; discharge from metal refineries;
erosion of natural deposits
Beryllium, mg/l
<0.002
0.004
Discharge from metal refineries and coal-buring factories;
discharge from electrical, aerospace, and defense industries
Cadmium, mg/l
<0.001
0.005
Corrosion of galvanized pipes; erosion of natural depositis;
discharge from metal refineries; runoff from waste batteries
and paints
Chromium (Total), mg/l
<0.020
0.1
Discharge from steel and pulp mills; erosion of natural
deposits
Chromium 6 (Hexavalent Chromium), mg/l
0.00006
NA
Commonly discharged from steel and pulp mills as well as
metal plating and leather tanning facilities
Cyanide, mg/l
<0.050
0.2
Discharge from steel/metal factories; discharge from plastic
and fertilizer factories
Fluoride, mg/l
0.73
4
Water additive which promotes strong teeth; erosion of
natural deposits; discharge from fertilizer and aluminum
factories
Mercury, mg/l
<0.0004
0.002
Erosion of natural deposits; discharge from refineries and
factories; runoff from landfills and croplands
Selenium, mg/l
<0.010
0.05
Discharge from petroleum refineries; erosion of natural
deposits; discharge from mines
Thallium, mg/l
<0.001
0.002
Leaching from ore-processing sites; discharge from
electronics, glass and drug factories
EMJWTP 2016 Annual Finished Water Quality Report
Page 2