


 141 / 144

STATISTICAL REVIEW
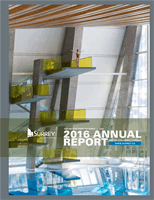
Gross Debt supported by Property Tax versus Total Debt
(in millions)
Source: City of Surrey Financial Services Division
Gross Debt supported by Property Tax
Other Municple Debt
Total Debt (including internal borrowing)
Borrowing Capacity
$0
$200
$400
$600
$800
$1000
$1200
$1400
$1600
2016
2015
2014
2013
2012
Overlapping debt which represents the total debt of regional districts where the City of Surrey is a member and is jointly and
severally liable, is not included. The City's overlapping debt (in millions of dollars) was $1,960 in 2016 (2015: $1,956).
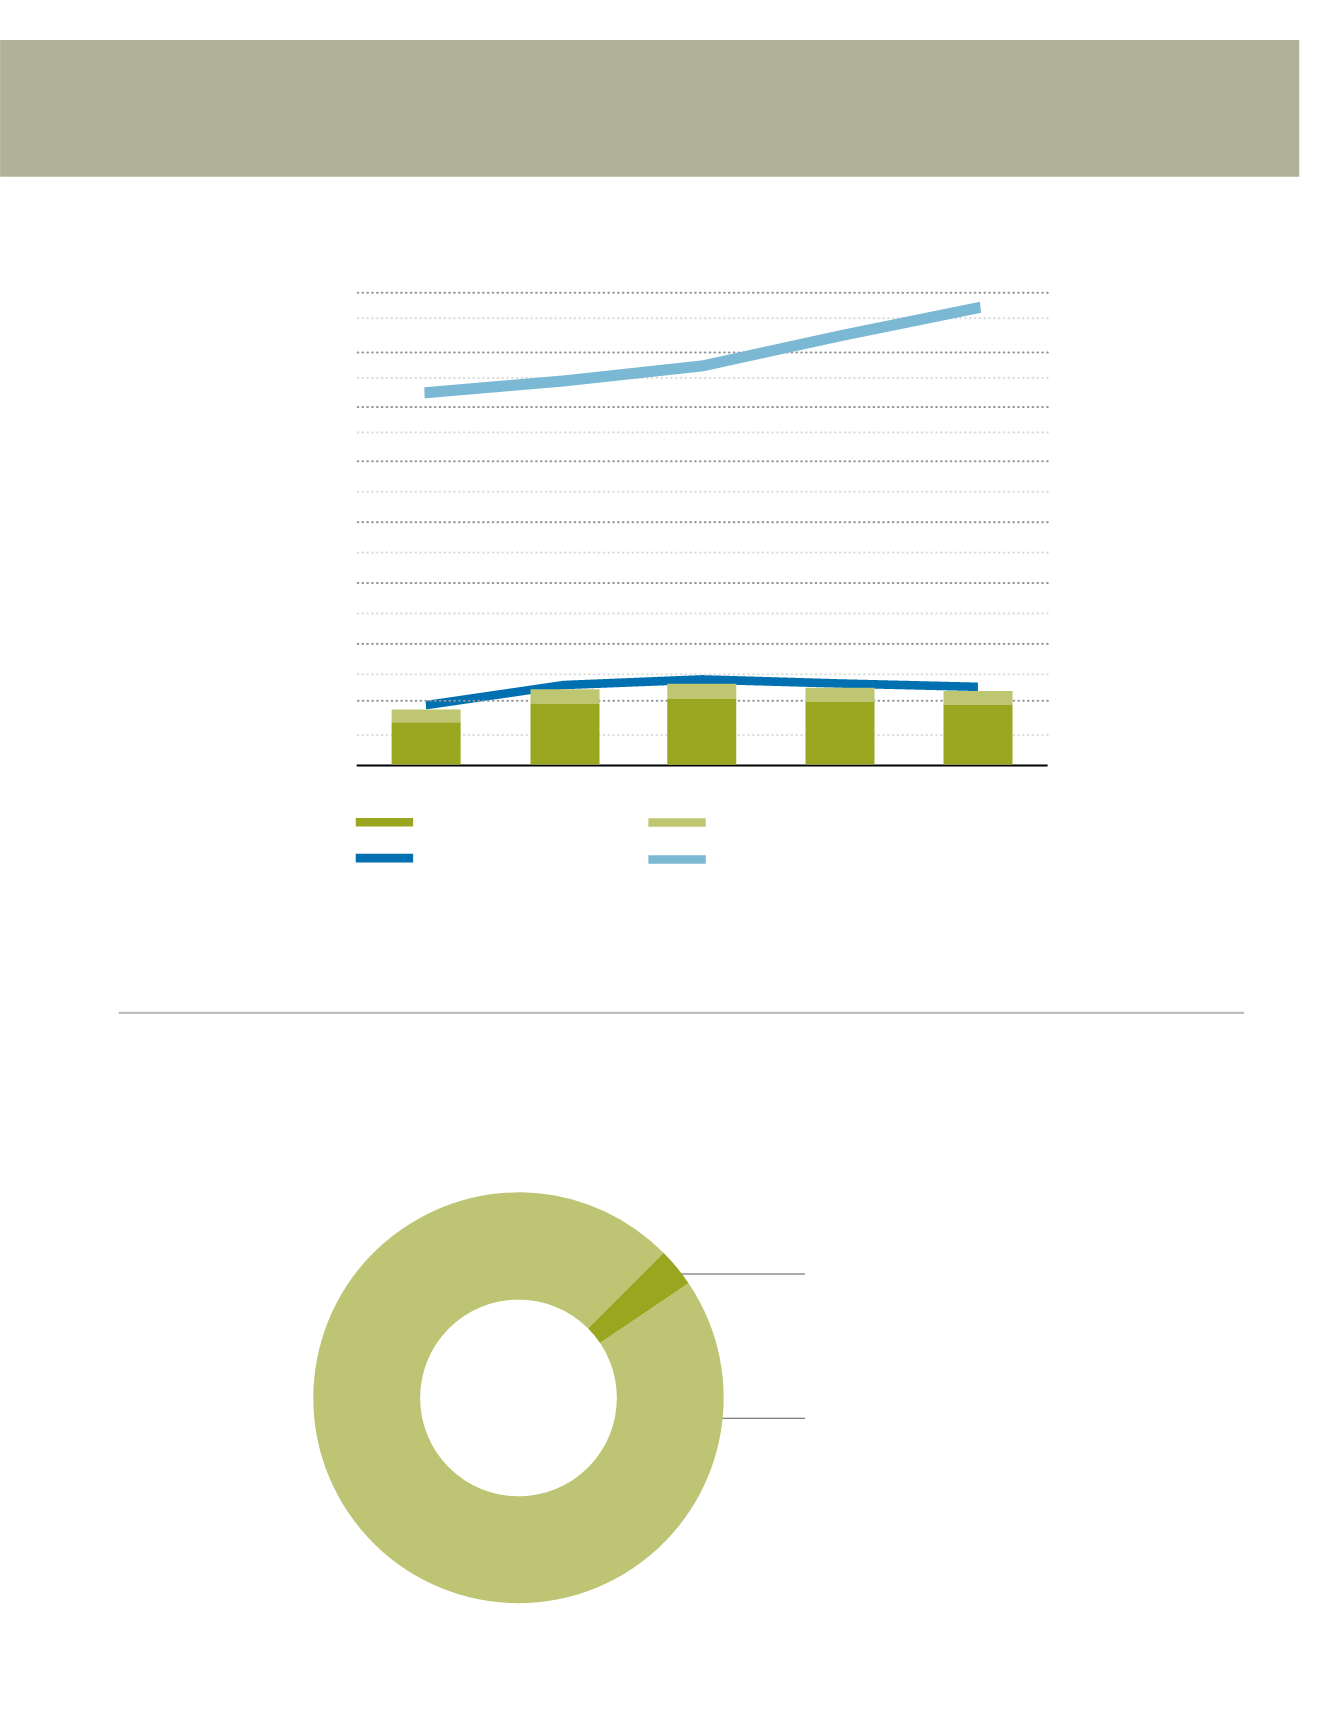
2016 Debt Servicing Costs Compared to General Taxation Revenue
(in thousands)
Source: City of Surrey Financial Services Division
Debt Servicing Costs Funded by
General Taxation Revenue, $12,780
General Taxation Revenue
Net of Debt Servicing Costs, $294,299
131