


 6 / 32

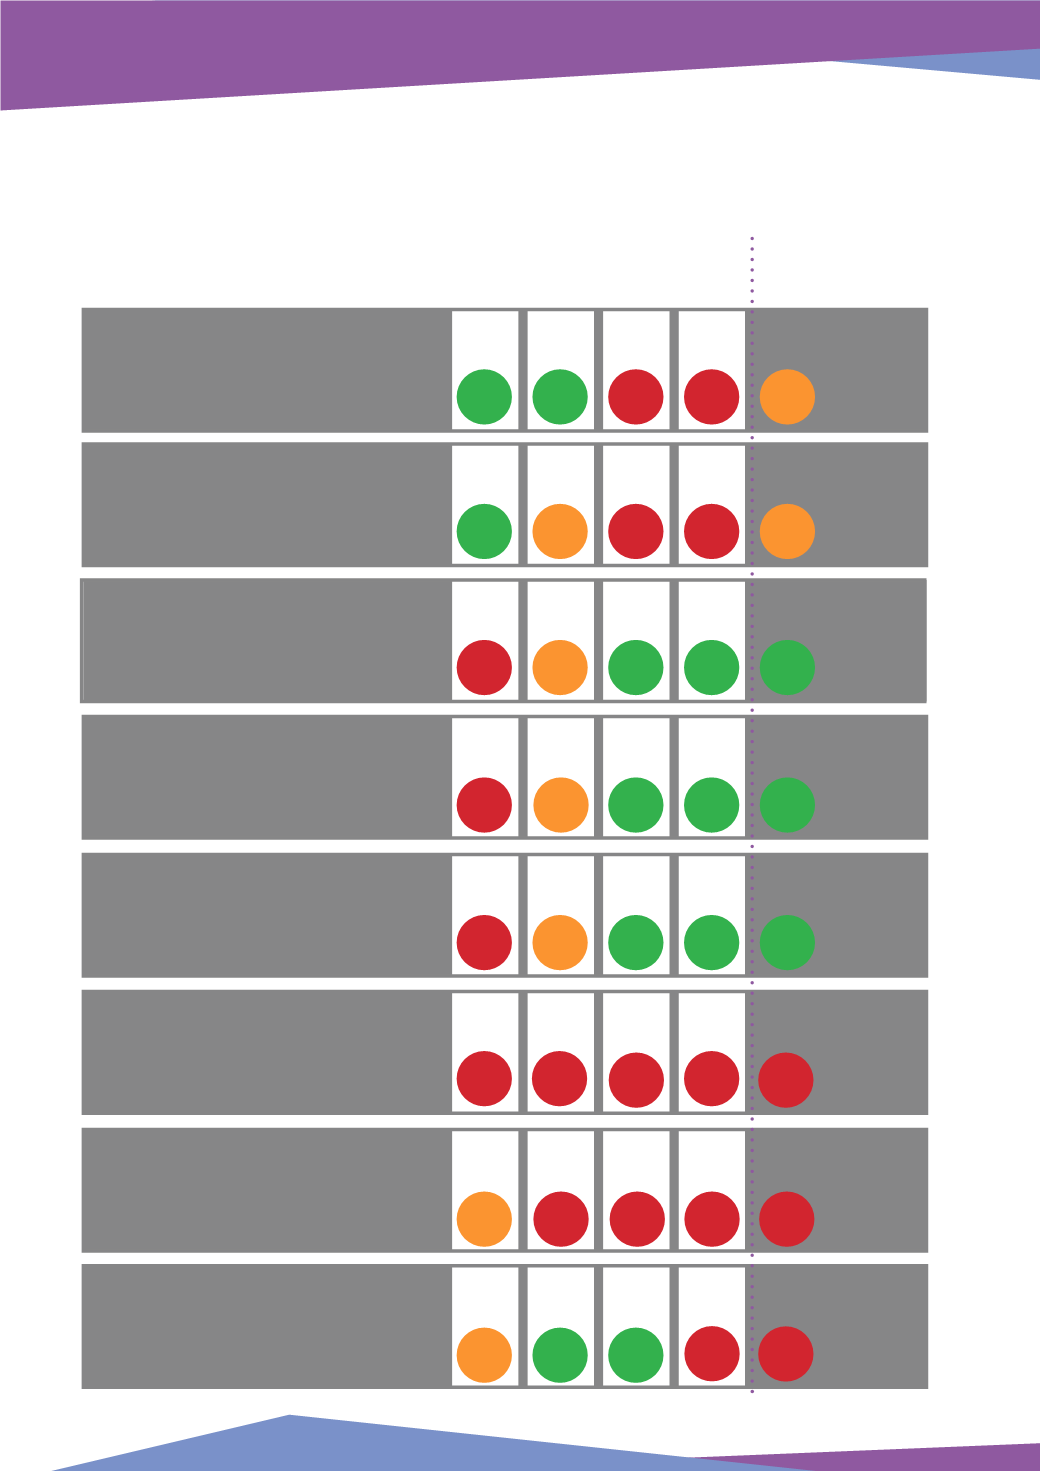
Development Well Count
a
Appraisal Well Count
a
Exploration Well Count
a
Total Production
(million barrels of oil equivalent)
Net Gas Production
(million barrels of oil equivalent)
Liquids Production
(million barrels of oil equivalent)
‘13 ‘14 ‘15 ‘16
‘17
Year-On-Year % Change
15
13
13
14
13-16
29
18
13
8
5-8
120 126 129 88
80-100
-9% -2% +13% +5% +4%
-7% +2% +7% +4% +4%
-8% 0% +10% +5% +4%
230 234 250 261
265-280
546 545 602 630
645-670
-32% -13% 0% +8% 0%
-6% -38% -28% -38% -25%
-2% +5% +2% -32% 0%
National Balancing Point
Day-Ahead Gas Price
(pence/therm)
68
50 42.6 34.6
40-50
+14% -26% -15% -19% +30
%
Brent Oil Price
($/barrel)
108.7 99 52.5 43.7
50-60
-3% -9% -47% -17% +26%
2. Key Performance Indicators
BUSINESS OUTLOOK
2017
6
Forecast
380-390
369
352
311
316