


 9 / 19

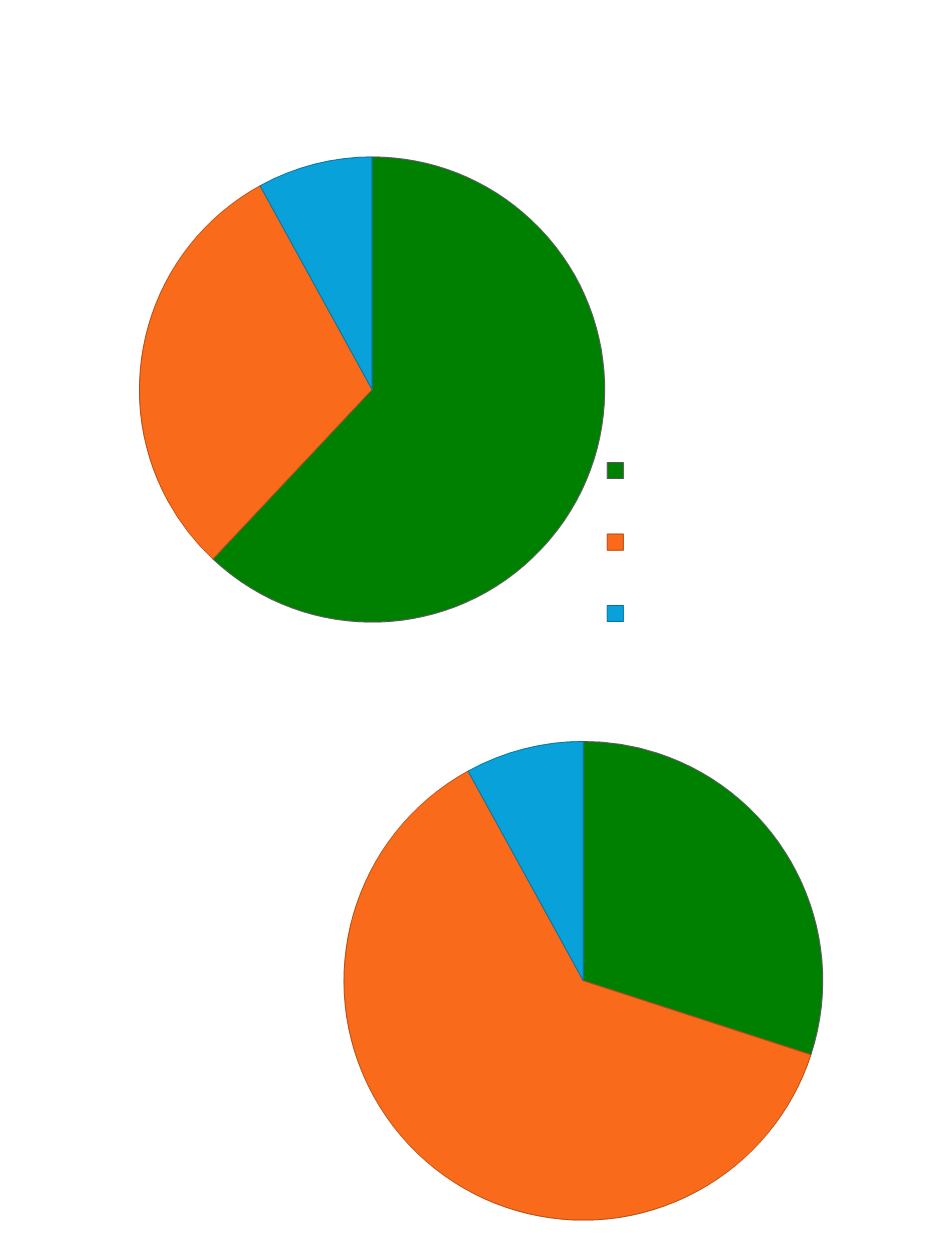
Example of funding pie charts
State
Funds
$6.2 M
62%
Local
Funds
$3.0 M
30%
Federal Funds
$0.8 M
8%
State
Funds
Local
Funds
Federal
Funds
Example A: District heavily reliant on state funds
Example B: District heavily reliant on local funds
State
Funds
$3.0 M
30%
Local
Funds
$6.2 M
62%
Federal
Funds
$0.8 M
8%