


 29 / 56


27
Statistics
Summary of Profit and Expense Ratios
Two-year Comparison
2016
2015
Gross Receipts
105,342
101,441
Gross Profit
32,701
31,690
Net Income
20,645
19,706
General and Administrative Expenses
14,468
14,222
Gross Profit as a Percentage of Gross Receipts
31.04%
31.24%
Net Profit as a Percentage of Gross Receipts
19.60%
19.43%
General and Administrative Expenses as a Percentage of Gross Receipts
13.73%
14.02%
(in 000s)
PEILCC 2015-2016 Annual Report
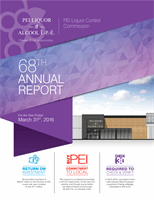
Our Spending...
All Profits Stay Here
Operating Costs:
4.9%
Returned to PEI:
37.3%
Salaries and Benefits:
8.7%
Cost of Product:
38.4%
5,228
9,240
39,368
40,517
Total Sales:
10,989
HST & Other:
10.4%
105,342