


 12-13 / 80

PEPM
2008
2009
2010
2011
2012
2013
2014
2015
2016**
Total Actual Average Medical Costs PEPM*
$836.34
$914.64
$784.40
$639.53
$646.68
$702.25
$722.00
$690.14
$745.40
Trended Costs (PWC)
$836.34
$913.29
$1,000.05
$1,090.05
$1,182.71
$1,271.41
$1,354.05
$1,446.13
$1,544.46
PEPM Difference (PWC - DoS)
N/A
($1.35)
$215.65
$450.53
$536.03
$569.16
$632.05
$755.99
$799.07
PEPM % Difference
N/A
0%
27%
70%
83%
81%
88%
110%
107%
DoS Actual Change Year over Year
N/A
9.4%
-14.2% -18.5%
1.1%
8.6%
2.8% -4.4% 8.0%
Trend Increases (PWC)
N/A
9.2%
9.5%
9.0%
8.5%
7.5%
6.5% 6.8% 6.8%
Average Monthly Covered Employees
332
355
417
455
373
354
367
372
382
Year over Year Enrollment Change
N/A
7.0%
17.5%
8.9%
-17.9% -5.1%
3.6% 1.3% 2.7%
Annual Variance vs. Trend (Savings)
N/A
($5,772)
$1,080,178
$2,457,621
$2,400,342
$2,417,787
$2,781,641
$3,370,954
$3,659,732
Cumulative Variance vs. Trend (Savings)
N/A
($5,772)
$1,074,406
$3,532,027
$5,932,369
$8,350,156
$11,131,797
$14,502,751
$18,162,484
Loss Ratio
109.3% 130.1% 104.1% 82.5% 91.3% 92.5% 94.8% 92.7% 89.5%
*Includes RX, Stop Loss Reimbursements and Dental claims costs.
** These estimates are based on data through the first 5 months of the plan year.
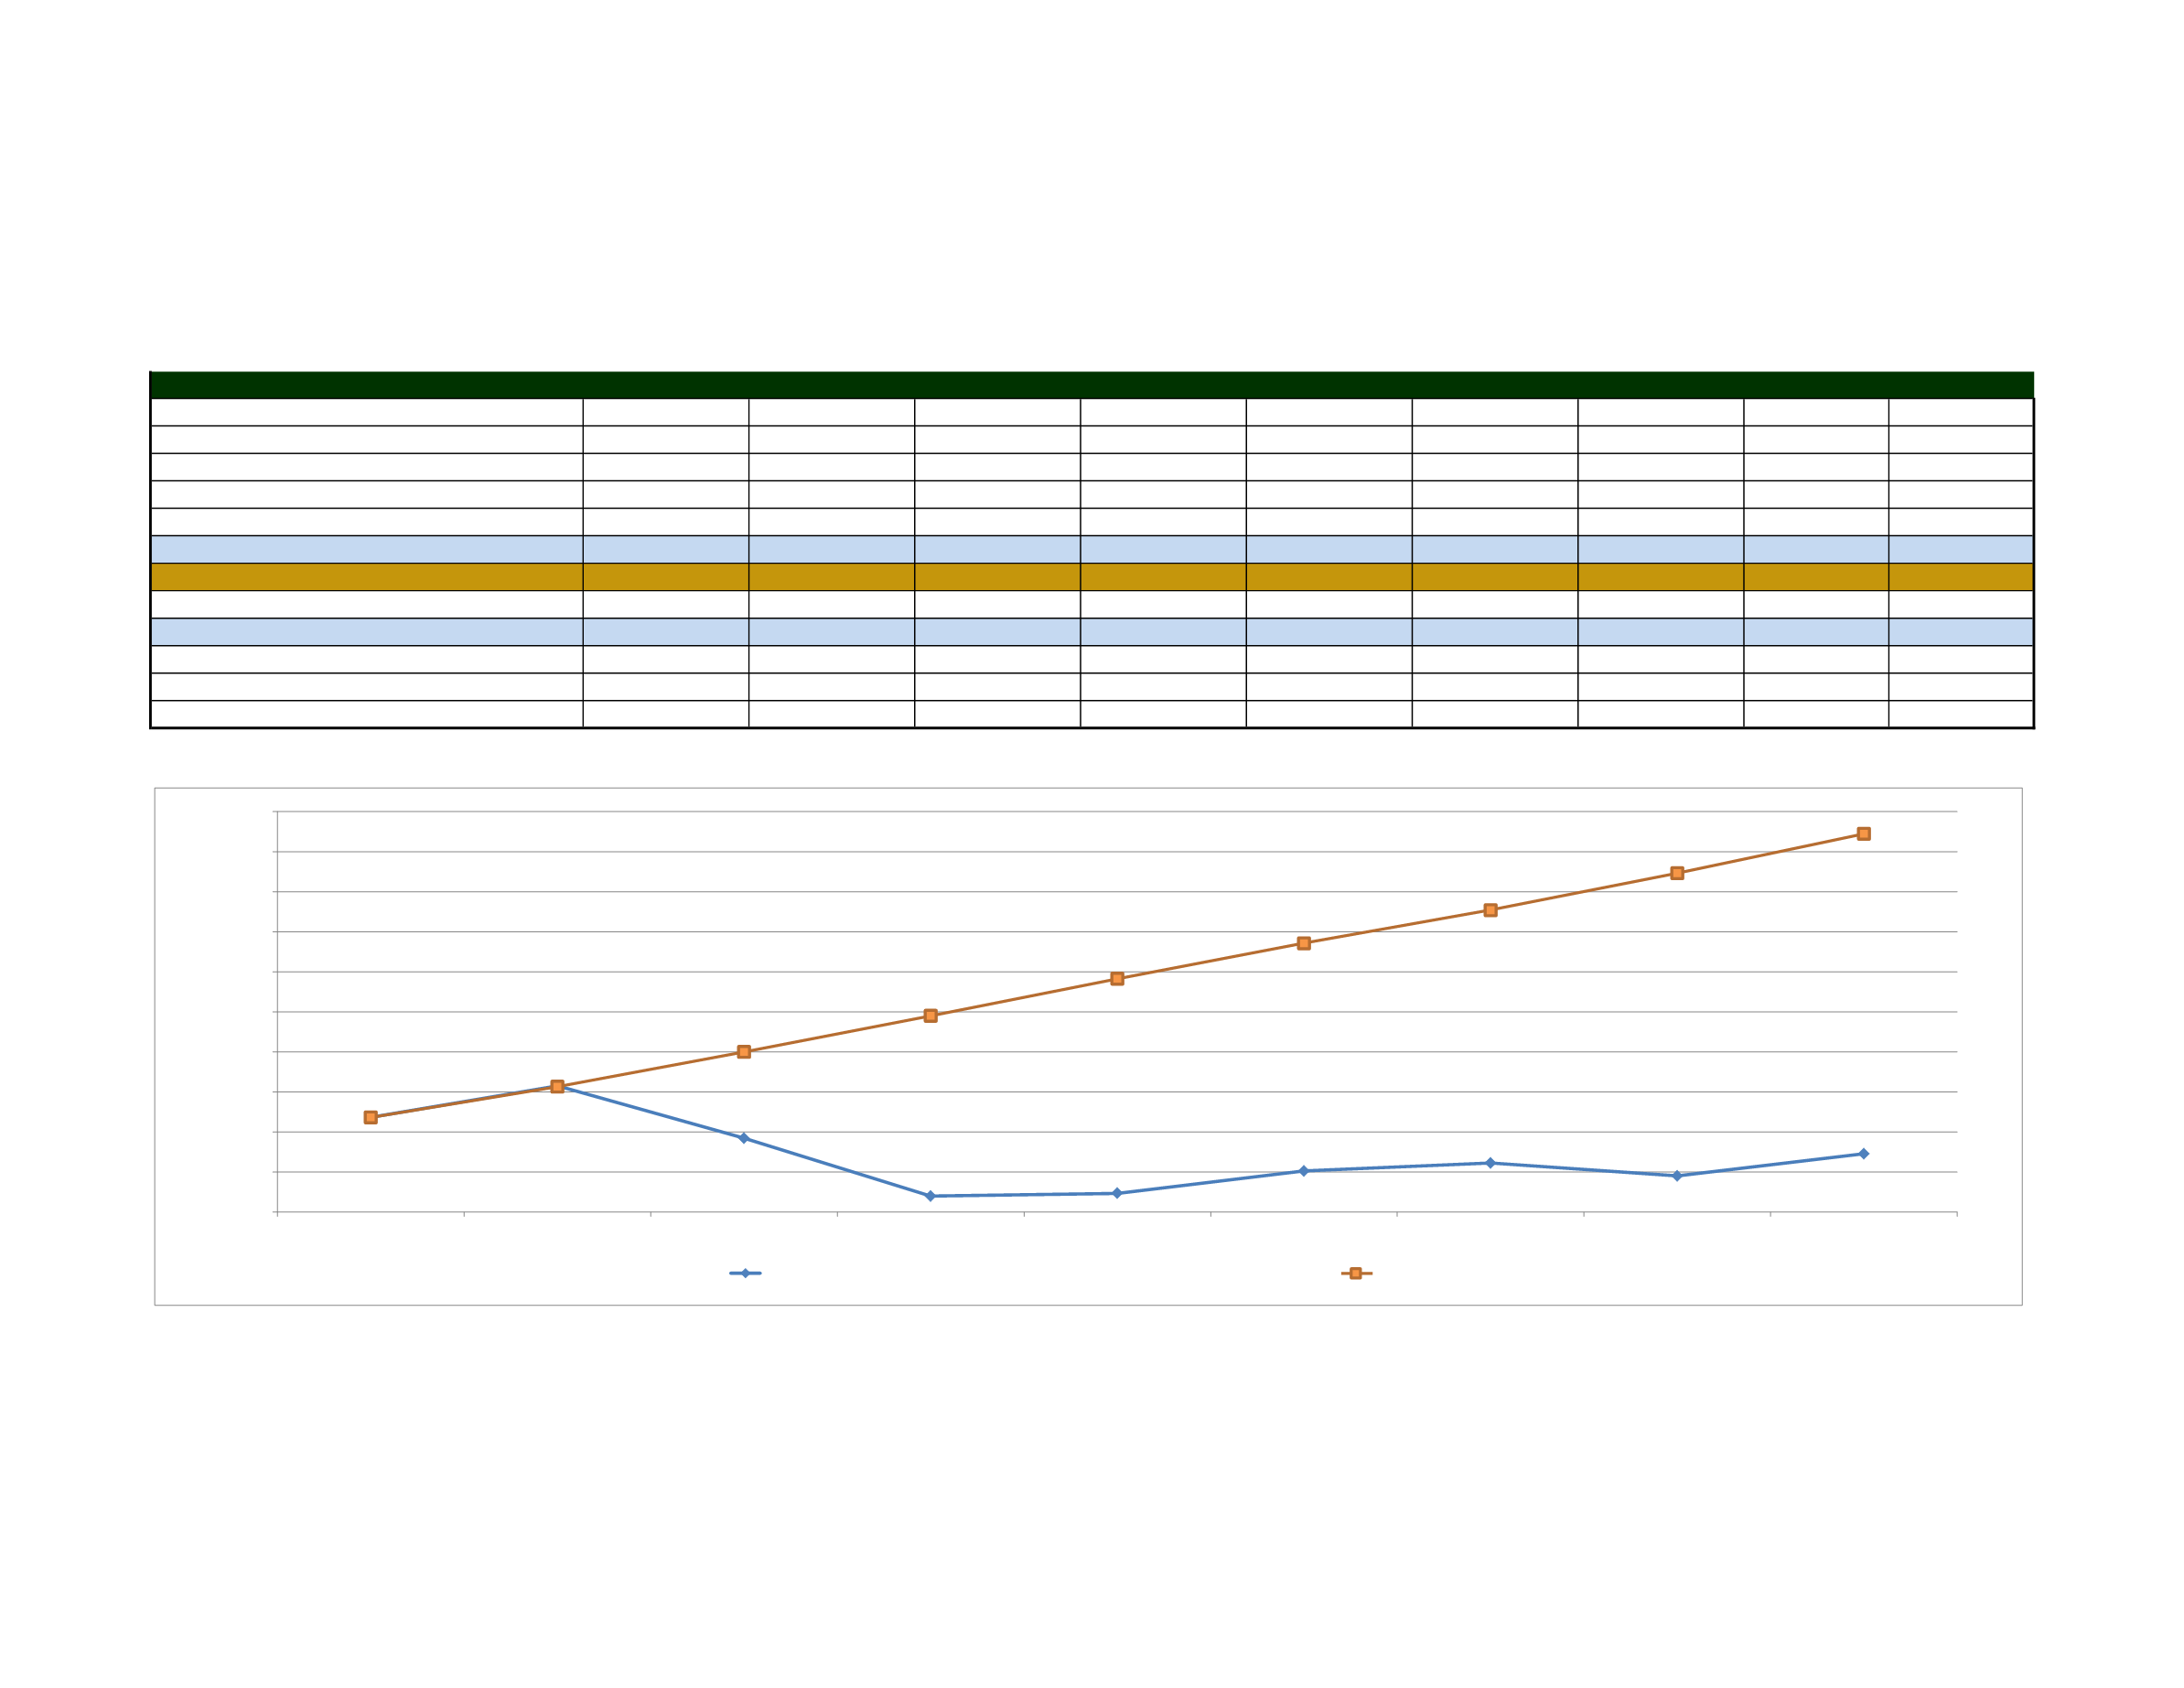
DoS Medical Trend History - PEPM
$836
$915
$784
$640
$647
$702
$722
$690
$745
$836
$913
$1,000
$1,090
$1,183
$1,271
$1,354
$1,446
$1,544
$600
$700
$800
$900
$1,000
$1,100
$1,200
$1,300
$1,400
$1,500
$1,600
2008
2009
2010
2011
2012
2013
2014
2015
2016**
DoS Actual PEPM
DoS Trended (PWC)