


 22 / 44


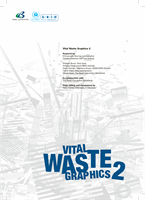
US dollars
per person per year
0
10
20
30
40
50
60
70
Solid waste management cost
for selected cities
Toronto
New-York
Strasbourg
London
Kuala Lumpur
Budapest
Sao Paulo
Buenos Aires
Riga
Bogota
Caracas
Manilla
Bucharest
Tallinn
Hanoi
Madras
Lahore
Dakha
Accra
Fukuoka
Macao
Kathmandu
Surabaya
Cebu
Ulan Bator
Sources: MacFarlane, 1998; UN/ESCAP, IGES, 2002.
WASTE MANAGEMENT
Dump, bury or burn?
Not long ago the amount and composition of waste was such that it
could be simply diluted and dispersed into the environment. Most items
were reused and only a few remained, that would not decompose natu-
rally. With industrialisation and rising urban density, a new concept fol-
lowed: collect and dump out of sight. The aim was to eliminate waste
or at least protect the population from it. This generally involved either
openly burning it (still practised today in many countries, this is a major
source of toxic gas emissions such as dioxins and furans) or dumping
it on specially designated landfill sites. In most countries landfill is still
the most popular option. It is the second largest source of greenhouse
gas emissions in the US (after fossil fuel combustion).
As garbage piles up, however much space we set aside for landfill,
we are beginning to realise that producing waste at this rate is no lon-
ger viable. It is time for the three “Rs”: Reduce, Reuse, Recycle and
integrated waste management. Waste management strategies are as
diverse as waste itself. But whatever we do there is no escaping the
“waste of waste” (unless we rein in our greed and buy less). Incineration
residue, even from plants proporely equipped with filters, represents
about a quarter of the original volume. The residues partly consist of
highly concentrated ashes containing hazardous substances.