


 12 / 56

© 2012 AOAC INTERNATIONAL
G
UIDELINES
FOR
S
TANDARD
M
ETHOD
P
ERFORMANCE
R
EQUIREMENTS
AOAC O
FFICIAL
M
ETHODS
OF
A
NALYSIS
(2012)
Appendix F, p. 2
policy. SMPR working groups are expected to apply their expertise
in the development of SMPRs.
TableA1: Performance Requirements
. Provides recommended
performance parameters to be included into an SMPR. Table A1
is organized by five method classifications: (
1
) main component
quantitative methods; (
2
) trace or contaminant quantitative
methods; (
3
) main component qualitative methods; (
4
) trace or
contaminant quantitative methods; and (
5
) identification methods.
The table is designed to accommodate both microbiological and
chemical methods. Alternate microbiological/chemical terms are
provided for equivalent concepts.
Table A2: Recommended Definitions
. Provides definitions
for standard terms in the SMPR Guidelines. AOAC relies on
The International Vocabulary of Metrology Basic and General
Concepts and Associated Terms
(VIM) and the International
Organization for Standadization (ISO) for definition of terms not
included in Table A2.
TableA3: Recommendations for Evaluation
. Provides general
guidance for evaluation of performance parameters. More detailed
evaluation guidance can be found in
Appendix D, Guidelines for
Collaborative Study Procedures to Validate Characteristics of
a Method of Analysis
(2);
Appendix I, Guidelines for Validation
of Biological Threat Agent Methods and/or Procedures
(3);
Appendix K, AOAC Guidelines for Single-Laboratory Validation
of Chemical Methods for Dietary Supplements and Botanicals
(4);
Codex Alimentarius Codex Procedure Manual (5); and ISO
Standard 5725-1-1994 (6).
Table A4: Expected Precision (Repeatability) as a Function
of Analyte Concentration
. The precision of a method is the
closeness of agreement between independent test results obtained
under stipulated conditions. Precision is usually expressed in terms
of imprecision and computed as a relative standard deviation
(RSD) of the test results. The imprecision of a method increases
as the concentration of the analyte decreases. This table provides
target RSDs for a range of analyte concentrations.
Table A5: Expected Recovery as a Function of Analyte
Concentration
. Recovery is defined as the ratio of the observed
mean test result to the true value. The range of the acceptable mean
recovery expands as the concentration of the analyte decreases.
This table provides target mean recovery ranges for analyte
concentrations from 1 ppb to 100%.
Table A6: Predicted Relative Standard Deviation of
Reproducibility (PRSD
R
)
. This table provides the calculated
PRSD
R
using the Horwitz formula:
PRSD
R
= 2C
–0.15
where C is expressed as a mass fraction.
Table A7: POD and Number of Test Portions
. This table
provides the calculated probability of detection (POD) for given
sample sizes and events (detections). A method developer can use
this table to determine the number of analyses required to obtain a
specific POD.
Informative annexes
.—The SMPR Guidelines contain
informative annexes on the topics of classification of methods, POD
model, HorRat values, reference materials, and method accuracy and
review. As with the informative tables, these annexes are intended to
provide guidance and information to the working groups.
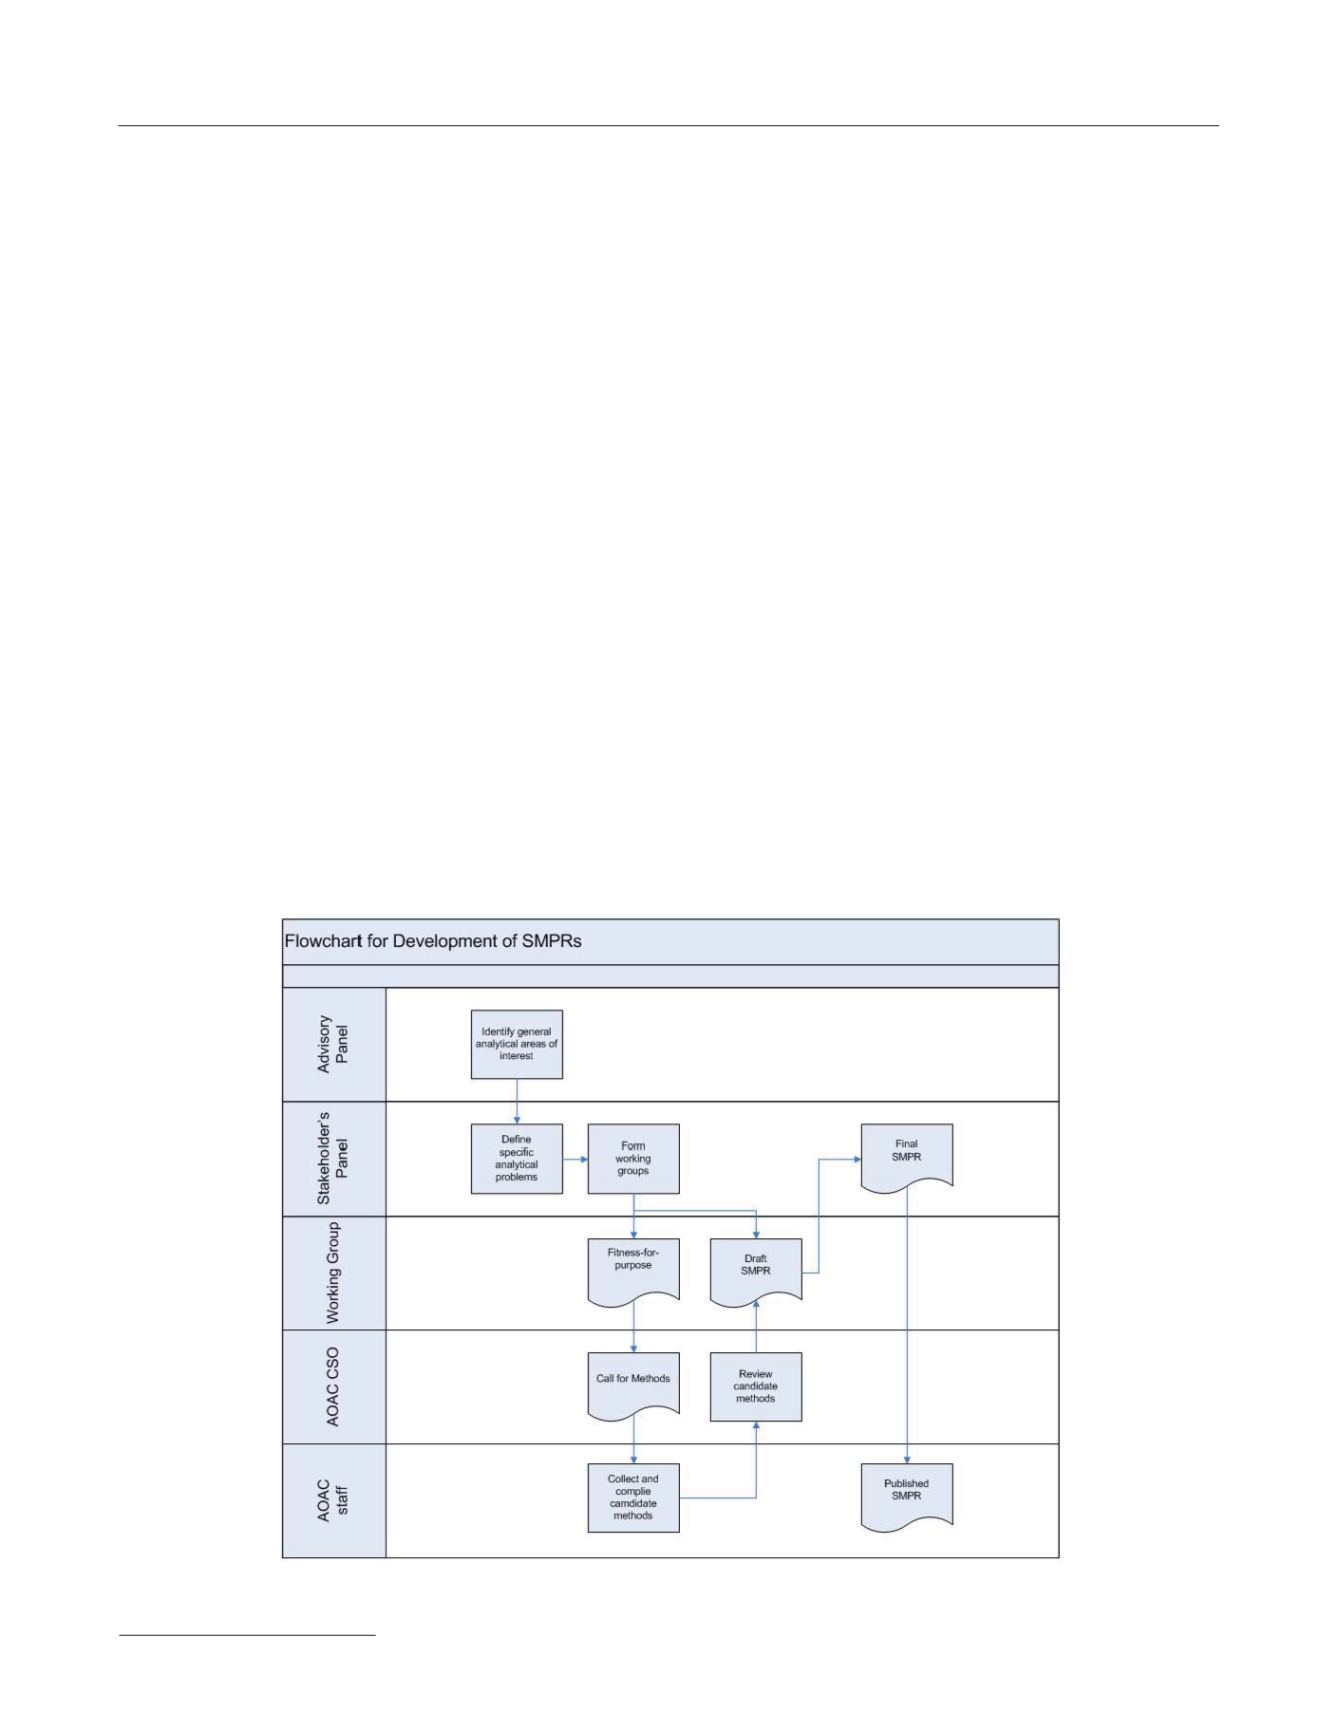
Initiation of an SMPR
See
Figure 1 for a schematic flowchart diagram of the SMPR
development process.
Figure 1. Schematic flowchart diagram of the SMPR development process.