


 11 / 55

9
‘
B
lanc
D
u
B
ois
ʼ
weight in ‘Blanc Du Bois’ (Table 3). In 2013,
when shoot thinning was analyzed as a main
effect, clusters/vine and yield/vine were higher
in NST vines compared to ST vines (Table 3),
indicating that NST vines produced flowers on
non-count shoots. Significant differences were
only found in 2013 for clusters/vine and yield/
vine for shoot thinning and cluster thinning
treatments overall (Table 1), perhaps due to
freeze damage to the primary bud, resulting in
fruit arising from secondary buds.
Grapevine
buds
contain
primary,
secondary, and tertiary buds, each with a
certain potential for fruit production. Clusters
arising from secondary shoots (secondary
buds) are smaller, whereas the majority of
tertiary shoots (buds) have been reported to
not produce any clusters (field observation;
Dry, 2000). In contrast, shoots coming from
the cordon of cold-injured Merlot vines were
fruitful (Keller and Mills, 2007). Thus, freeze
damage in combination with shoot thinning
most likely resulted in fewer clusters with
fewer berries and lower berry weight in the
ST treatment (Table 3). In addition, juice from
shoot thinned vines possessed significantly
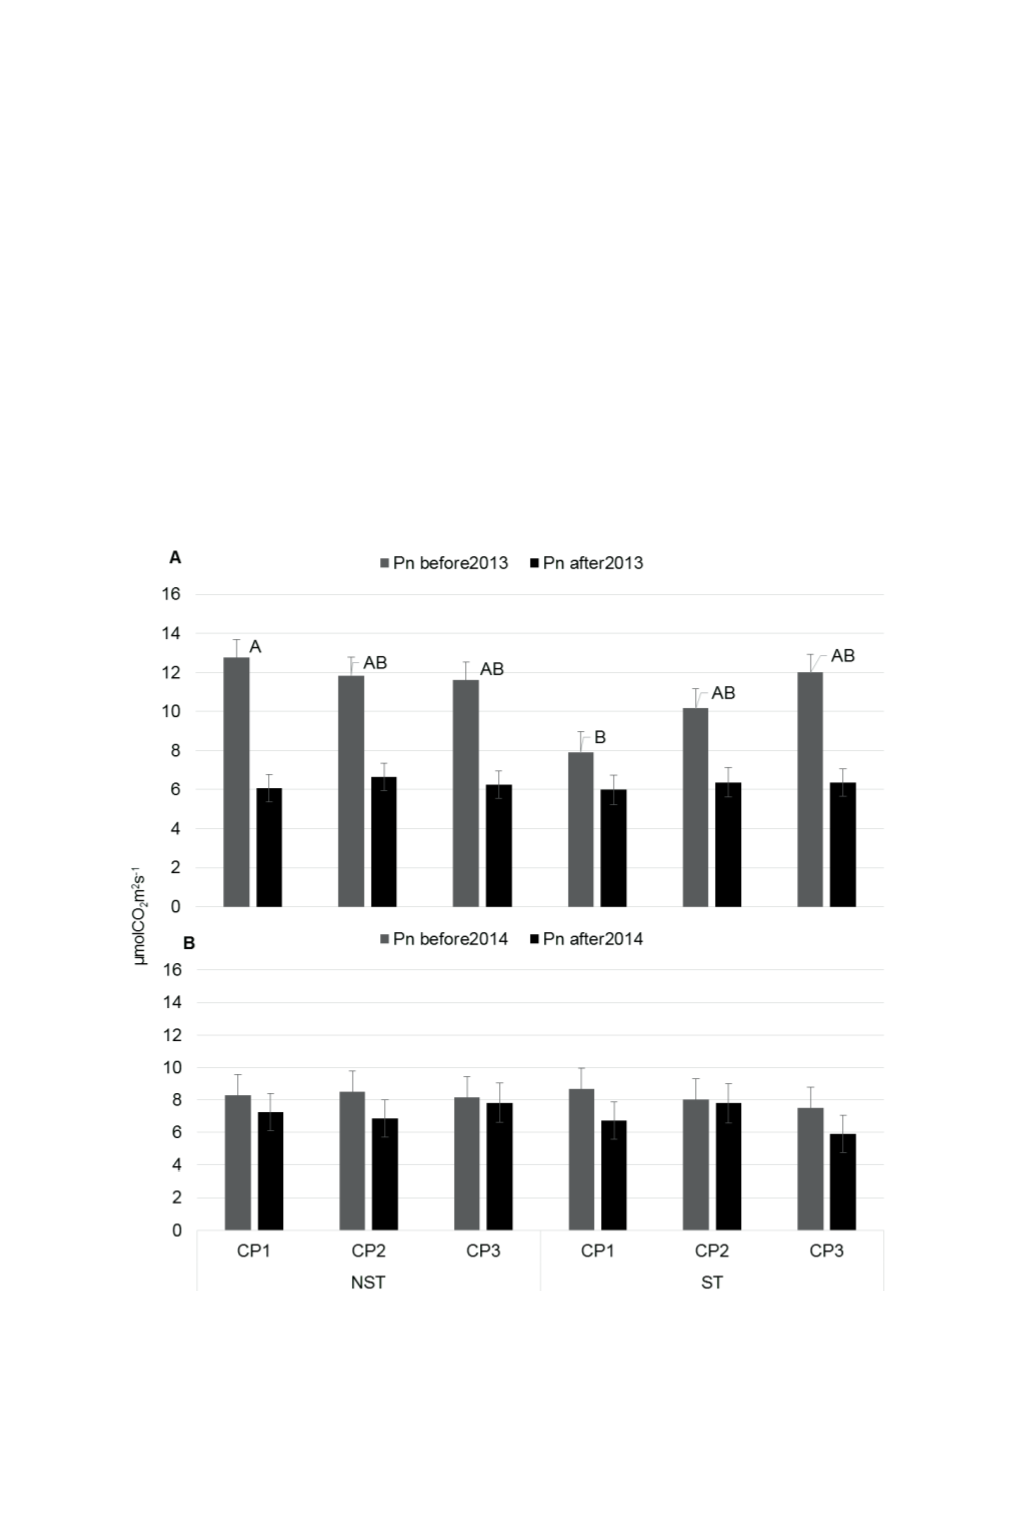
Figure 4. Photosynthesis rate measurements (µmol CO
2
m
-2
·s
-1
) as affected by the
interaction of shoot and cluster thinning before and after harvest in 2013 (A) and 2014
(B). NST: Non-shoot thinned and ST: shoot thinned vines. CP1: one cluster per shoot,
CP2: two cluster per shoot, CP3: three clusters per shoot. Error bars denote ± SE of the
mean. Letters indicate mean separation as determined by Tukey’s HSD (
p
< 0.05).
Fig. 4:
Photosynthesis rate measurements (μmol CO
2
m
-2
•
s
-1
) as affected by the interaction of shoot and cluster
thinning before and after harvest in 2013 (A) and 2014 (B). NST: Non-shoot thinned and ST: shoot thinned vines.
CP1: one cluster per shoot, CP2: two cluster per shoot, CP3: three clusters per shoot. Error bars denote ± SE of
the mean. Letters indicate mean separation as determined by Tukey's HSD (
p
< 0.05).