


 45 / 80


45
0
100
200
300
400
500
Relative number of transactions
2002
1998
1996
2004
2000
2006 2008 2010
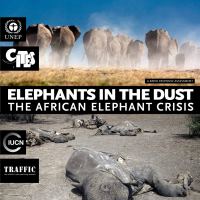
Ivory transaction index
Source: ETIS, June 2012
ETIS Transaction index depicts global illegal ivory trade activity in six ivory type
and weight categories, providing a measure of the frequency of raw and worked
ivory transactions occurring from 1996 onwards, with 1998 set to 100 to
constitute a baseline for comparative purposes.
Baseline
90% con dence intervals
Transaction index trend
representative of underlying trade trends which are only revealed
following complex statistical modeling techniques using bias-ad-
justed data. ETIS is able to provide relative, but not absolute, total
trade quantities over time. While more and more countries are
providing data to ETIS, participation by some countries, includ-
ing a number of elephant range States remains poor. It is worth
noting that Angola, Benin, Equatorial Guinea, Liberia, Senegal,
Somalia and Togo, all African elephant range States, and Cam-
bodia, Laos and Myanmar, all Asian elephant range States, have
never reported a single elephant product seizure case to ETIS
over the 23-year period since 1989.
Trends in ivory seizures
Overall, using weight and transaction indices derived from the
ETIS data, illegal ivory trade activity remained at or slightly
above 1998 levels up to 2006. Subsequently, a gradual increase
in illegal ivory trade activity commences, becoming progres-
sively greater in each successive year, with a major surge in
2011. The frequency of illegal ivory trade transactions in 2011
Figure 12:
Ivory transaction index.
was roughly three times greater than the level of illegal trade
activity found in 1998. This applies to all categories of trade
– both for raw and for worked ivory of either less than 10 kg;
between 10 kg and 100 kg; and equal to or greater than 100 kg.
The ETIS data establishes that the frequency and scale of large-
scale ivory seizures continues to increase. Such seizures are
indicative of the presence of organised crime in the illicit trade.
From 2009 through 2011, 34 such seizure events occurred, a
record number in ETIS.
ETIS statistics indicate that Kenya and the United Republic of
Tanzania together accounted for 16 of the 34 large-scale ivory
seizure cases recorded from 2009 through 2011. The total
volume of ivory seized was 35 tonnes and accounts for 58 per
cent of the total volume of ivory derived from the large-scale
seizure events during this time period.
The sharp upward trend is being driven by a major increase in ivo-
ry transactions in the equal to or greater than 100 kg weight class.