


 20 / 48

Source : OECD, 2002.
In % of total waste generated
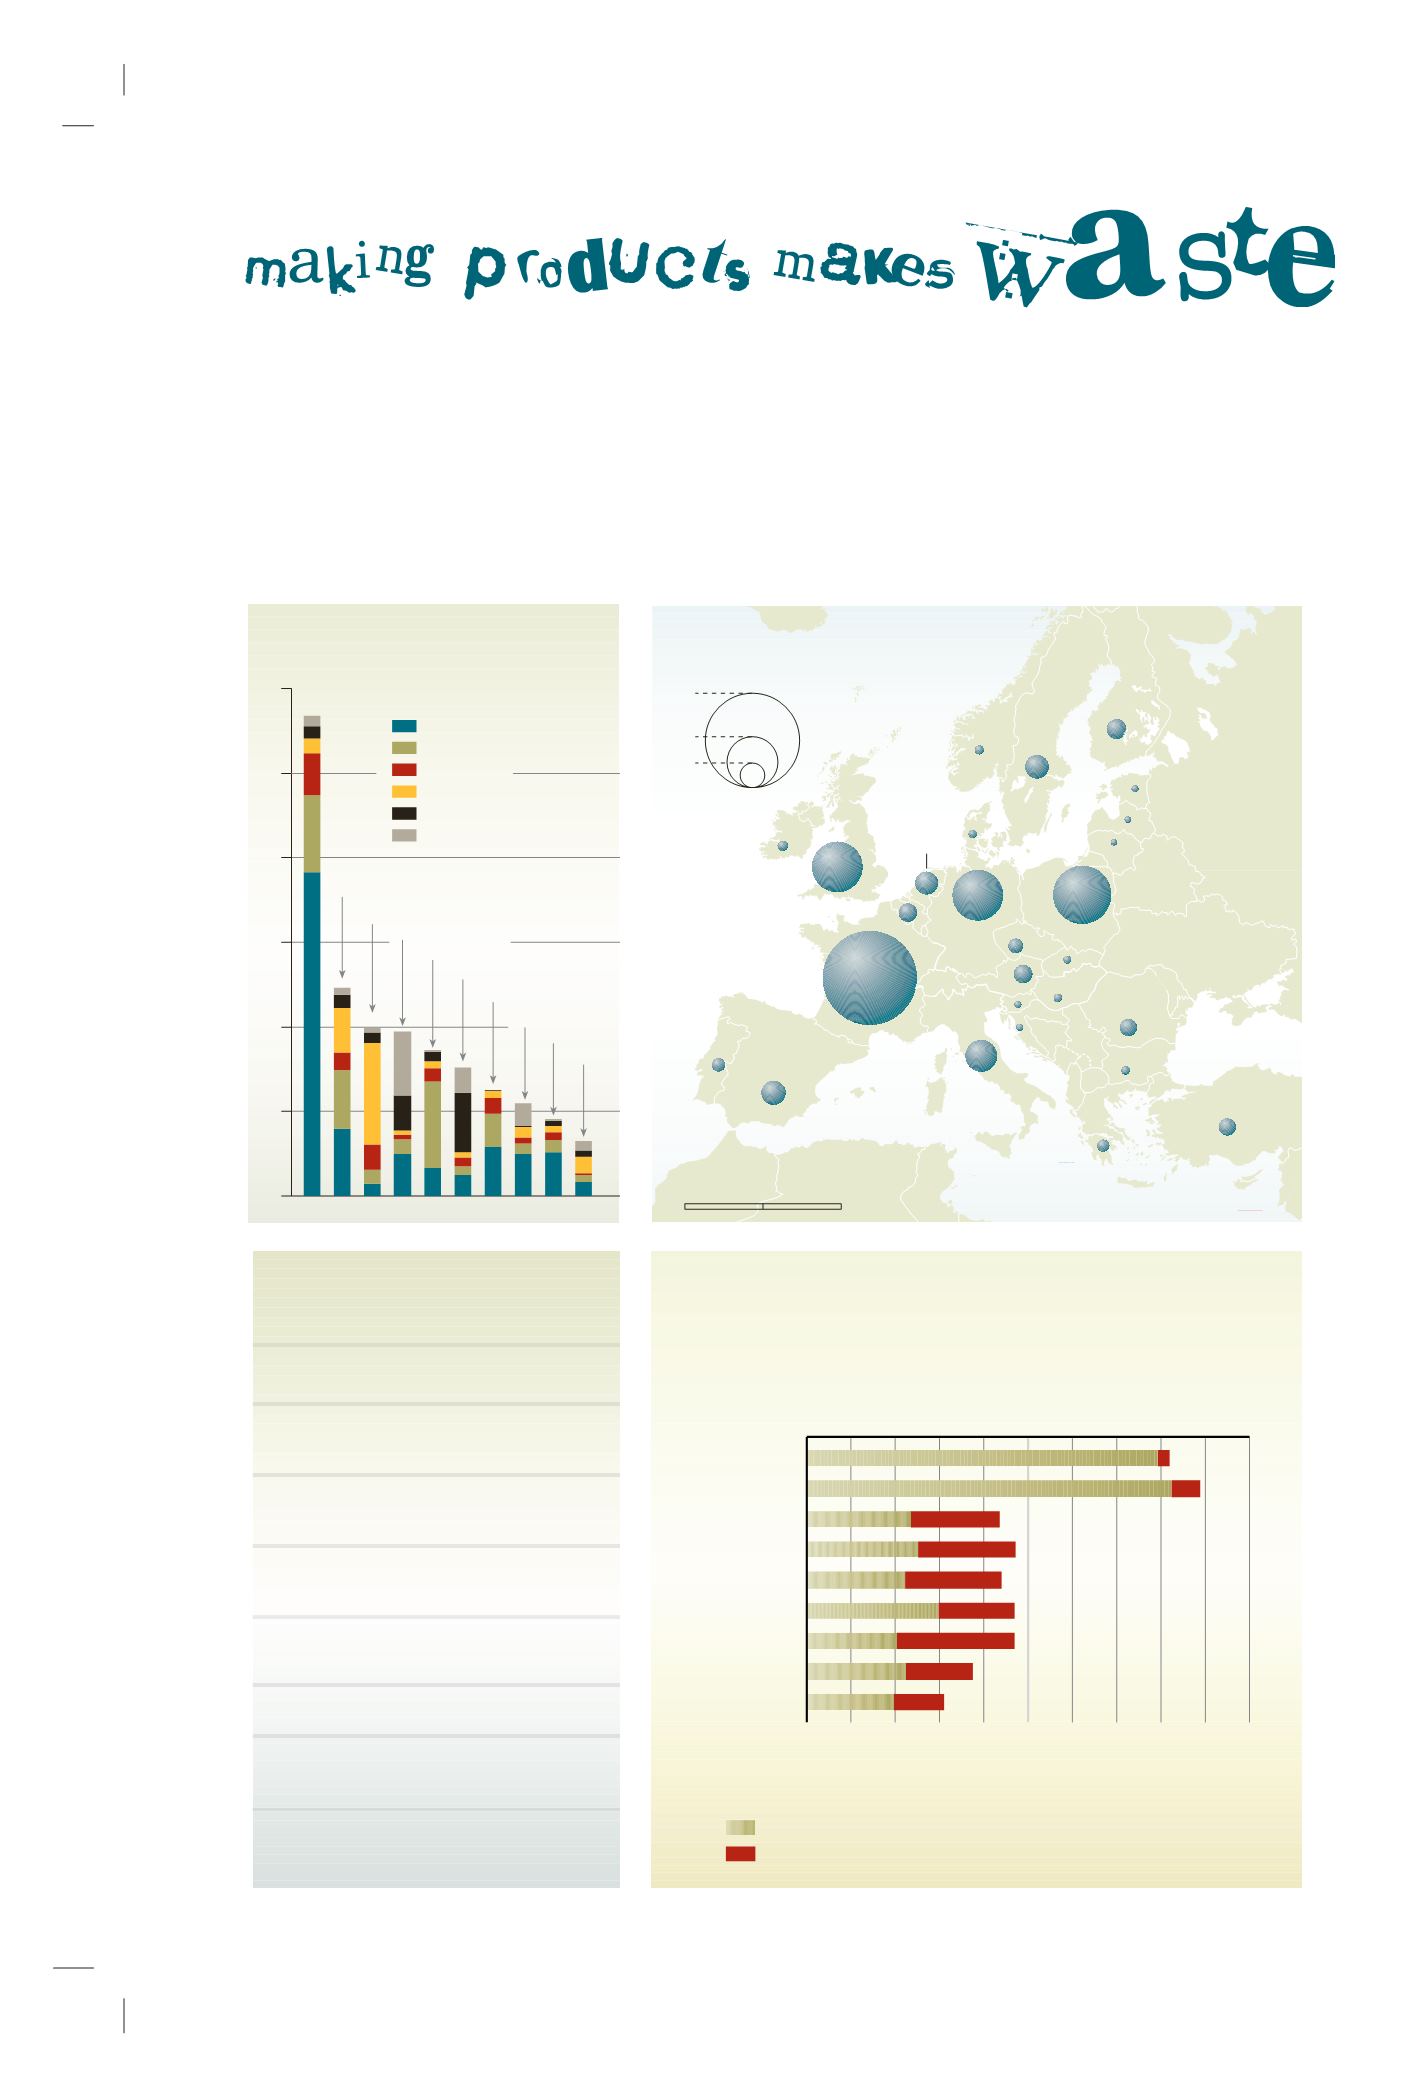
Agriculture and manufacturing waste generation
selected countries, latest year available
Finland
Japan
Netherlands
Slovakia
Czech Republic
Greece
Ireland
Hungary
10 20 30 40 50 60 70 80 90
0
100%
United Kingdom
Waste generated from:
agriculture and forestry
manufacturing
Source: Eurostat/OECD, 2002.
0
10
20
30
40
50
60
Million tonnes
Spain
Poland
Italy
Sweden
Netherlands
Finland
Turkey
Romania
Czech Rep.
Portugal
in selected EU countries,
latest year available
Most polluting industrial sectors
Wood
Paper and printing
Construction
Chemistry
Metal
Food and beverages
WASTE FROM MANUFACTURING AND AGRICULTURE
Turning raw materials into consumer products generates waste. This production waste includes
waste from both agricultural and manufacturing. Agricultural waste consists of things like pes-
ticide waste, discarded pesticide containers, plastics such as silage wrap, bags and sheets,
packaging waste, old machinery, oil and waste veterinary medicines. Manufacturing waste, as
you would expect from the vast range of products produced and processes involved, is a very
diverse group. The waste generated depends on the technology used, the nature of the raw ma-
terial processed and how much of it is discarded at the end of the chain. Very often manufactur-
ing wastes end up in the hazardous category.
NORV GE
BI LORUSSIE
UKRAINE
MOLDAVIE
ALBANIE
BOSNIE-
HERZ GOVINE
CROATIE
MER
M DITERRAN E
MER
NOIRE
MER
BALTIQUE
MER
DE NORV GE
GOLFE
DE
BOTNIE
MAC DOINE
YOUGOSLAVIE
R
ISLANDE
OC AN
ATLANTIQUE
Oslo
Helsinki
Stockholm
Berlin
Prague
Bratislava
Vienne
Ljubljana
Sofia
Rome
Ath nes
Ankara
Tallinn
Riga
Vilnius
Budapest
Varsovie
Bucarest
Londres
Dublin
Paris
Bruxelles
Amsterdam
Copenhague
Madrid
Lisbonne
Kosovo
Minsk
Kiev
Moscou
Saint-P tersbourg
Chisinau
Construction
europ enne
Source :Union europ enne.
Elargissement de
l Union europ enne
Austria
Germany
Finland
Latvia
Estonia
Lithuania
Poland
Romania
Bulgaria
Greece
Slovenia
Italy
Hungary
Turkey
Czech
Republic
Slovakia
Sweden
France
United Kingdom
Ireland
Spain
Portugal
Netherlands
Belgium
Denmark
Croatia
Norway
Waste generation from manufacturing
Source: Eurostat, OECD, EEA, 2002.
Million tonnes
50
98
20
0
500
1 000 km
Food and beverages
Animal waste
Cleaning wastes
Refrigerents
Cleaning
and cosmetic
Heavy metal dusts and sludges
Ignitable wastes
Solvents
Strong acids and bases
Vehicle
maintenance shops
Paint wastes
Ignitable wastes
Spent solvents
Acids and bases
Construction
Ignitable wastes
Paint wastes
Spent solvents
Strong acids and bases
Paper
and printing
Ink wastes, including solvents and metals
Photography waste with heavy metals
Ignitable and corrosive wastes
Heavy metal solutions
Metal
Paint wastes containing heavy metals
Strong acids and bases
Cyanide wastes
Sludges containing heavy metals
Chemistry
Strong acids and bases
Reactive wastes
Ignitable wastes
Discarded commercial chemical products
Ignitable wastes
Spent solvents
Paint wastes
The big waste factory
Typical hazardous wastes generated
by selected manufacturing industries
Source : UACPA, 2002.
Furniture and wood