


 22 / 48

Municipal waste is everything collected and treated by municipalities.
Only part of it is comes from households, the rest is generated by small
businesses, commercial and other municipal activities. So it is produced
from both consumption and production processes. Like all waste, mu-
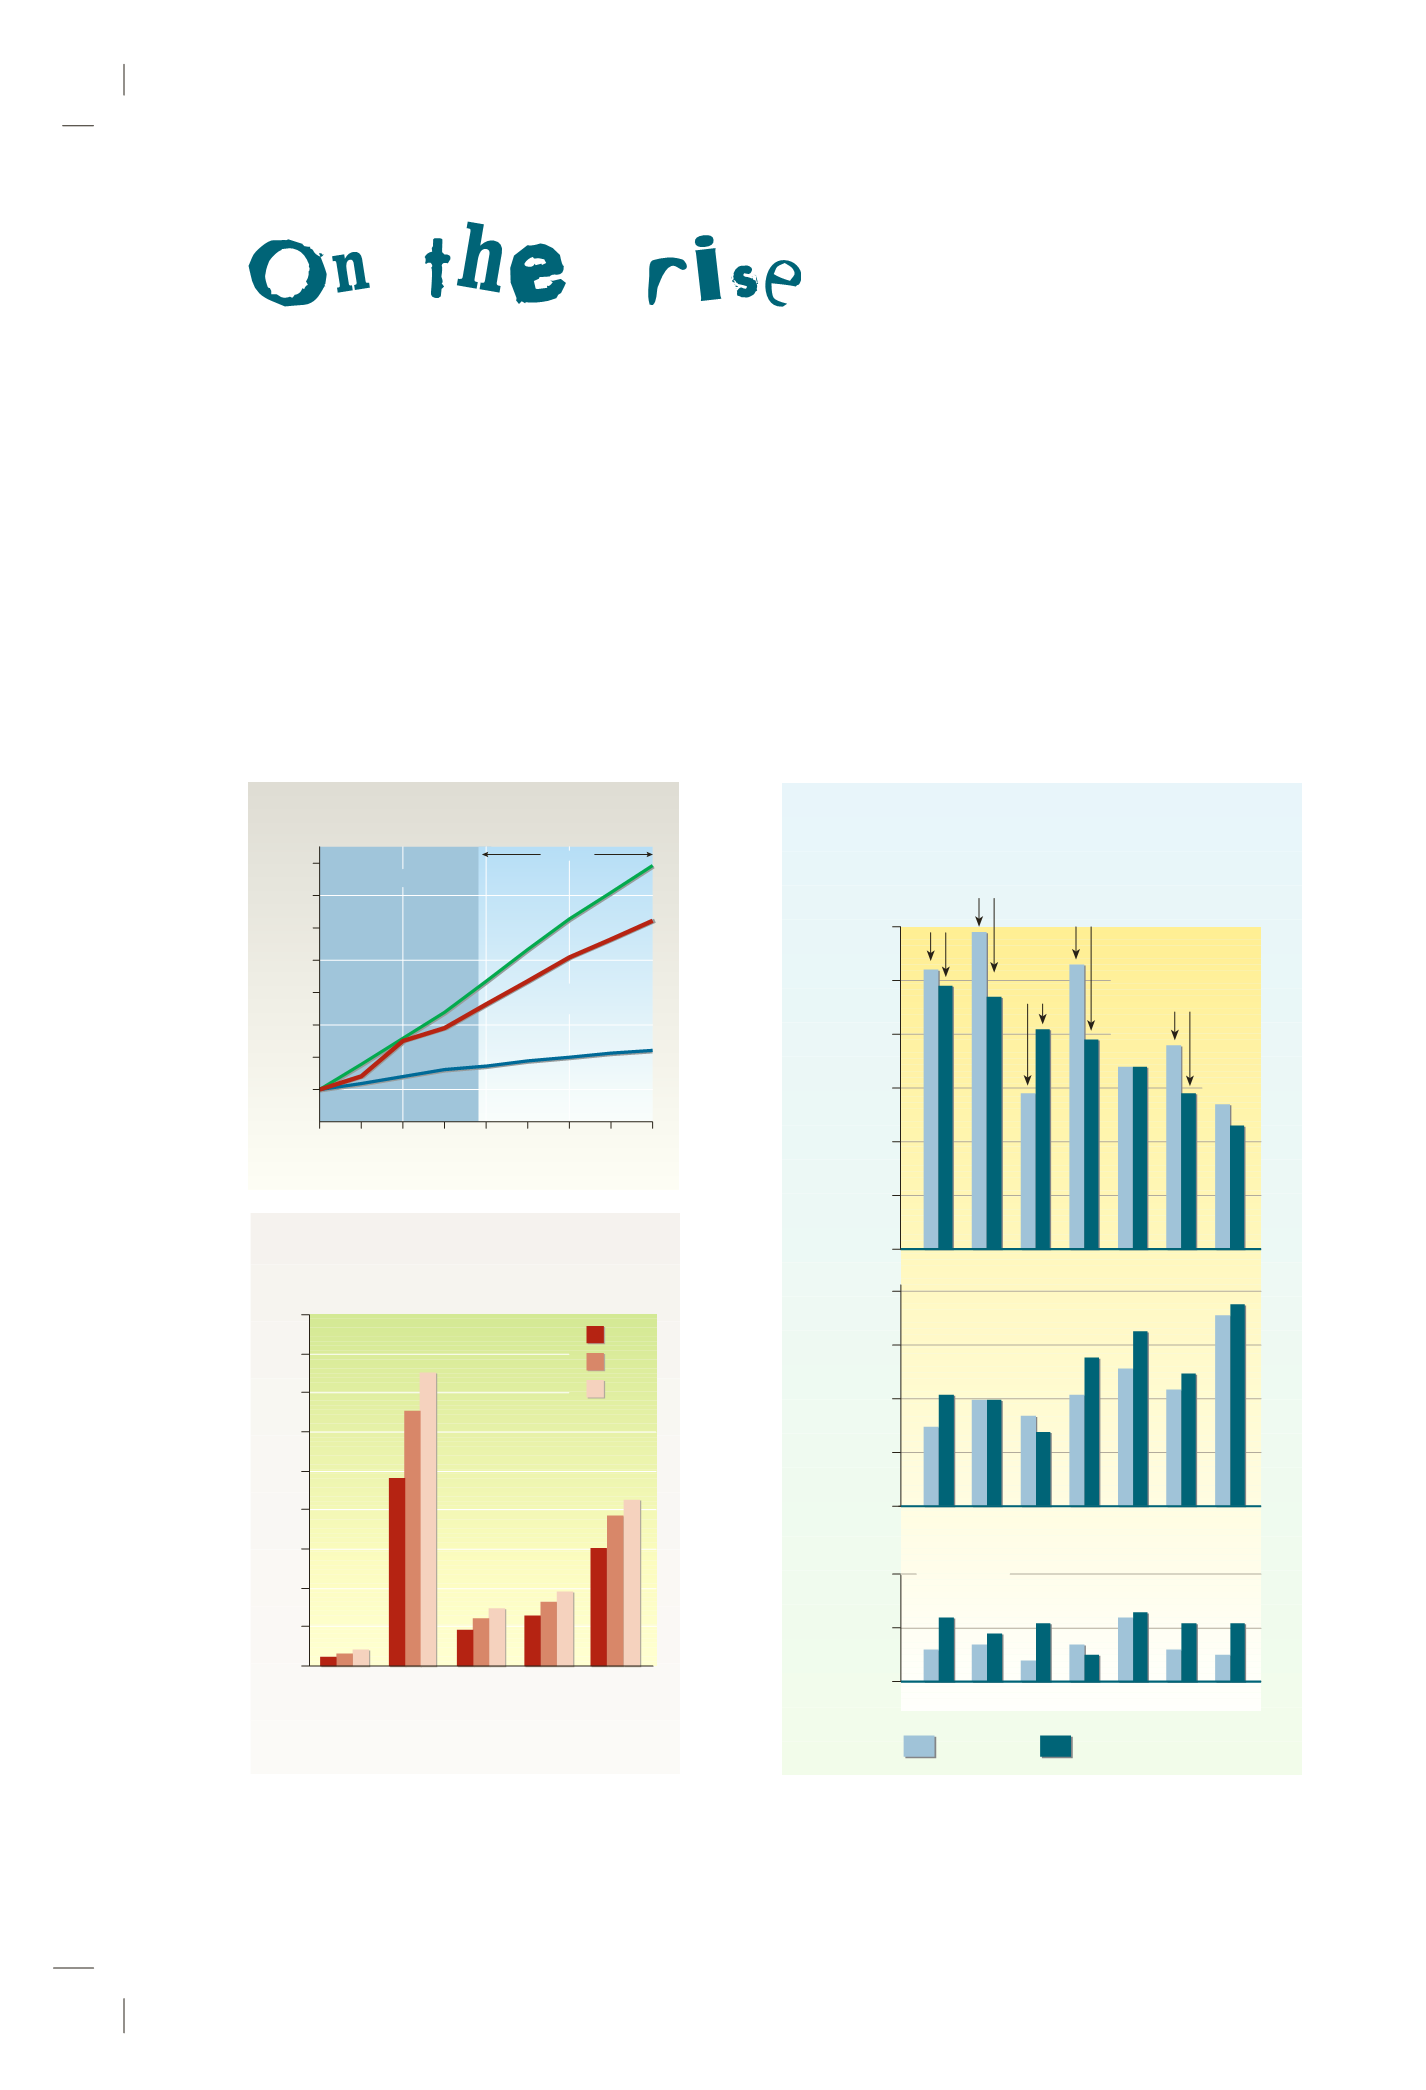
nicipal waste is on the rise and it is growing faster than the population,
a natural result of our increasing consumption rate and the shortening
of product life-spans. According to various scenarios, it will most likely
continue for the next decades – but at a slower pace for those countries
that can afford advanced waste management strategies. As 1.3 billion
Chinese thunder into the great pleasures of consumption, municipal
waste is certainly a major environmental concern.
A typical trend:
as countries get richer, the organic share
decreases whereas the paper and plastic ones increase.
MUNICIPAL WASTE
Source: OECD.
* data for Australia is an expert estimate
200
400
300
100
50
150
250
350
450
0
Projected trends in regional
municipal waste generation
Australia
and New
Zealand*
Canada,
United
States
and
Mexico
Central
and
Eastern
Europe
Japan
and Korea
Western
Europe
Million tonnes
1995
2010
2020
Paper
Organic
Plastic
Spain
Greece
Hungary
Netherlands
Japan
France
United
States
60
50
40
30
20
10
0
Percentage of
municipal waste
40
30
20
10
0
20
10
0
Changing percentages of selected municiple wastes
selected OECD countries, 1980-2000
Source: OECD, 2002.
ESP GRC HUN NDL JPN FRA USA
ESP GRC HUN NDL JPN FRA USA
1980
2000
GDP
100
120
140
160
180
200
220
240
projection
1980 1985 1990 1995 2000 2005 2010 2015 2020
Index 100 in 1980
Source: OECD, 1999.
Municipal Waste
Generation
The richer we get, the more we discard
Population
OECD countries