


 30 / 48

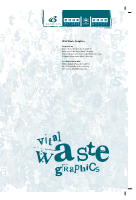
The amount of waste on the move is increasing rapidly. Reports to the
Basel Convention on the Control of Transboundary Movements of Haz-
ardous Wastes and their Disposal suggest that between 1993 and 2001
the amount of waste crisscrossing the globe increased from 2 million
tonnes to more than 8.5 million tonnes. What is this material that is be-
ing traded between countries, where is it from and where is it going?
Unfortunately data on waste movements are incomplete – not all coun-
tries report waste movements to the Basel Convention. However, we do
know that the movement of waste is big business.
Well travelled waste
Waste, including extremely hazardous waste like radioactive
material, toxic heavy metals and poisonous PCBs are routinely
being loaded into trucks, and transported across continents.
Some is loaded onto ships and exported to other countries.
Often the waste is being sent for recycling but some is just
dumped. Between 1993 and 1999 122 countries reported
nearly 30 000 waste exports. During this period Germany was
the top exporter (nearly 7 million tonnes) and France was the
leading importer (just over 3 million tonnes).
The traders
Approximately 75% of the total volume of waste
is traded between developed countries (OECD
members). At the second conference of the par-
ties to the Basel Convention, Parties adopted a
ban on the export of hazardous waste for final
disposal from OECD countries to non-OECD
countries (which has not entered into force). The
shipment of wastes intended for reuse or recy-
cling is currently negotiated between individual
countries, ensuring that OECD countries can still
export hazardous material for this purpose to
non-OECD countries.
What is being traded?
According to the Basel Convention reports, of more
than 300 million tonnes of waste (including hazard-
ous and other waste) generated worldwide in 2000,
a little less that 2% was exported. However 90%
of the exported waste was classified as hazardous.
The principal waste export by volume was lead and
lead compounds bound for recycling.
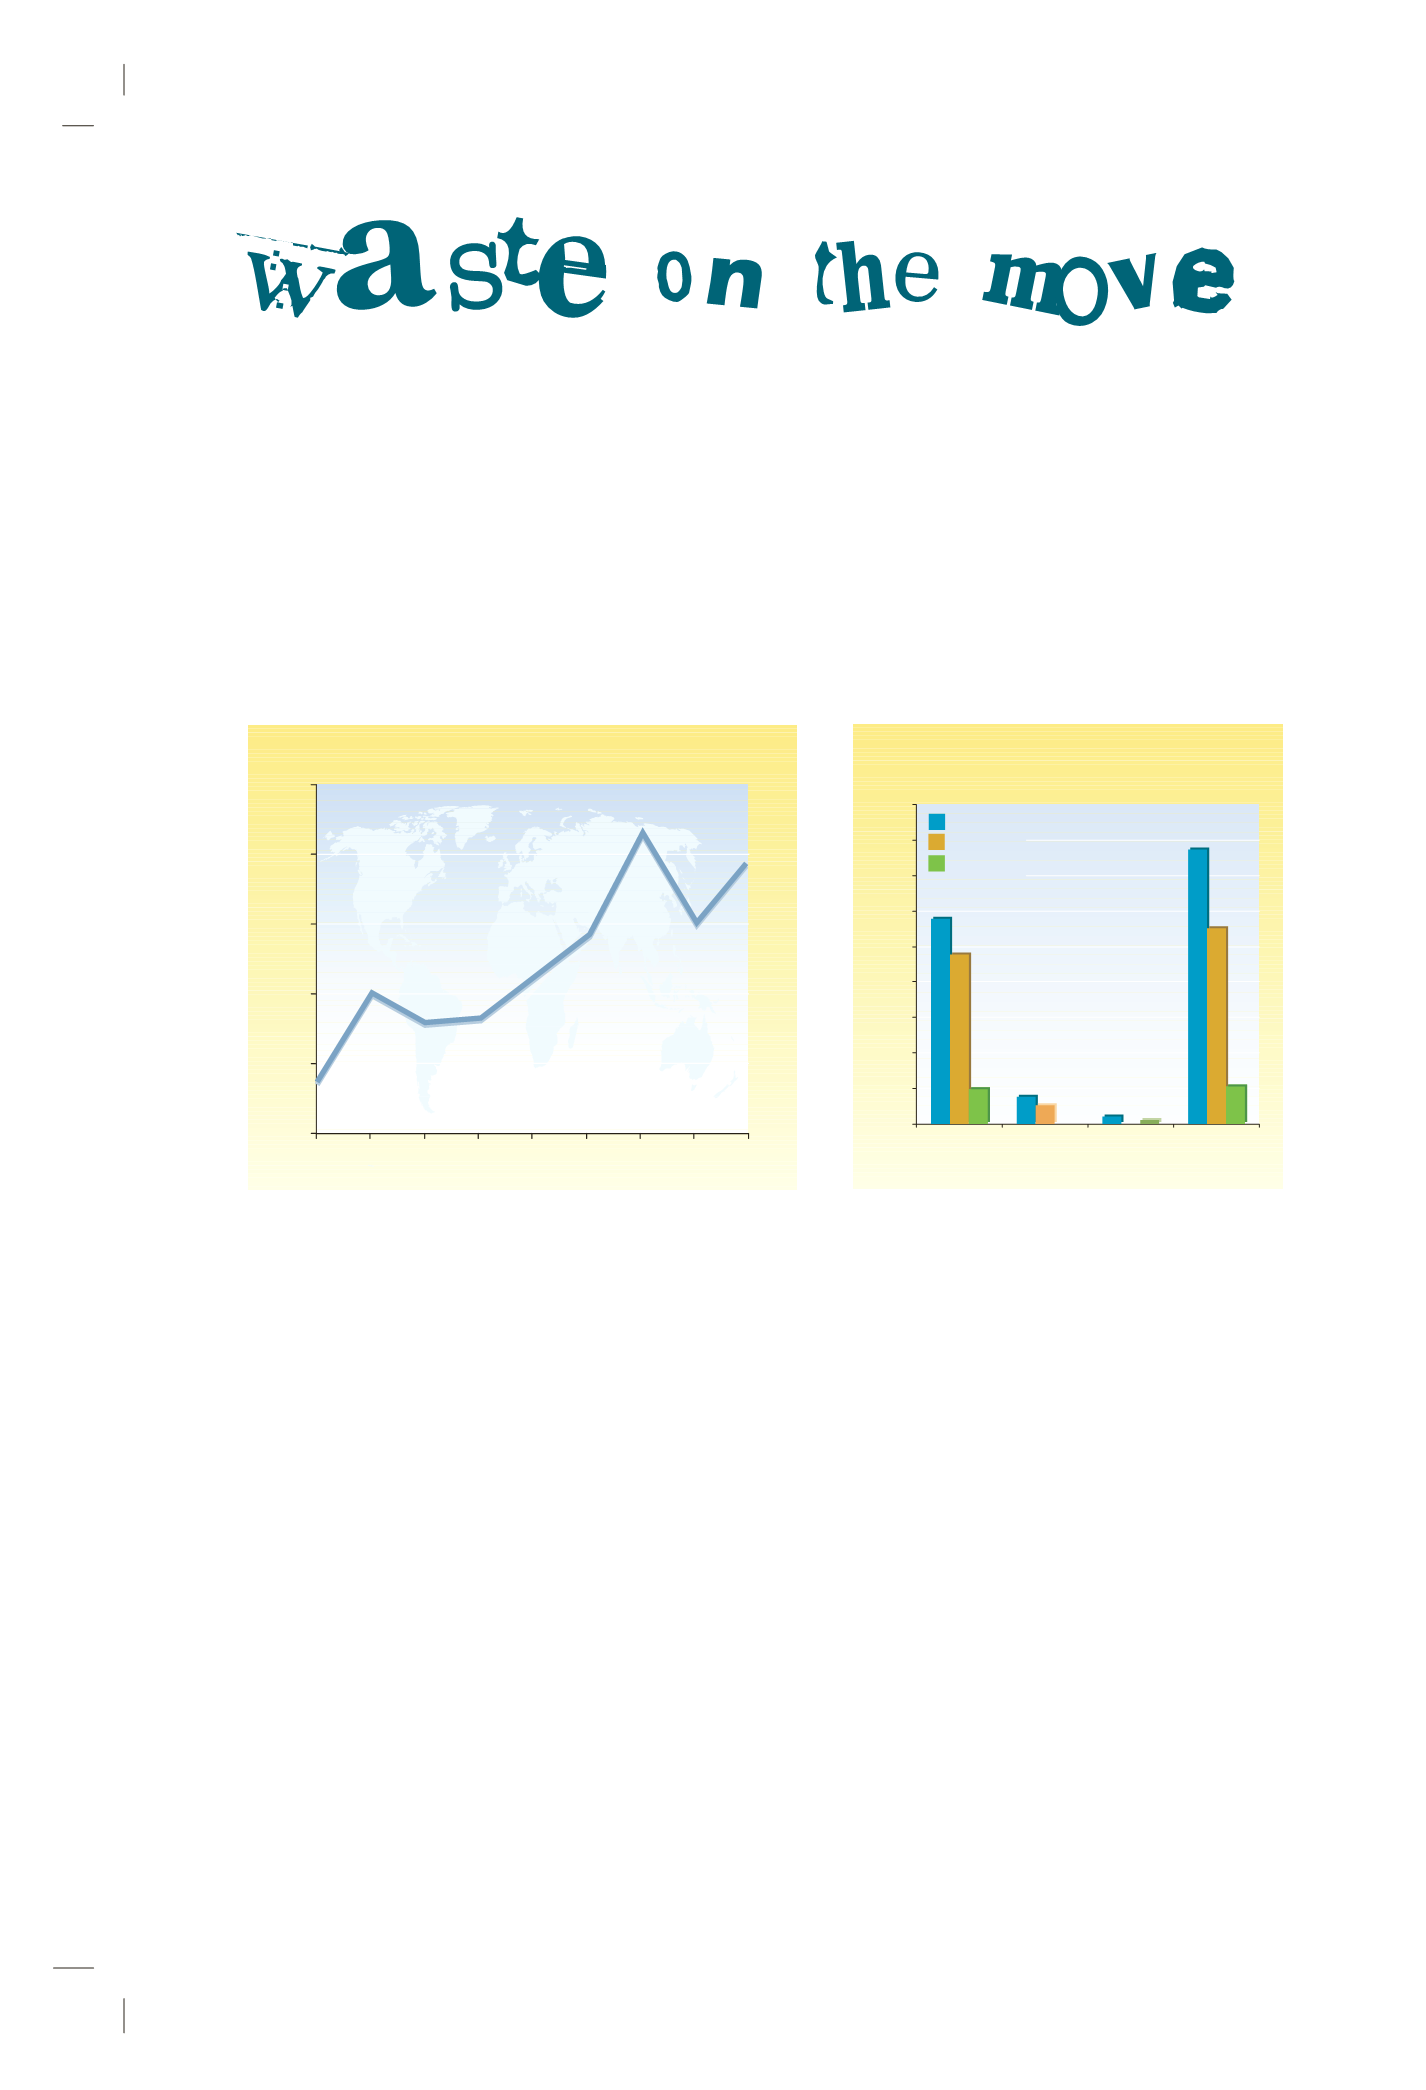
TRANSPORT AND TRADE
Transboundary movements of waste in 2000
Between
OECD
Between
Non-OECD
Between
OECD and
Non-OECD
Between
all Parties
Million tonnes
100
200
300
400
500
600
700
800
900
0
Total
Recycling
Disposal
Source: Basel Convention
0
4
8
12
16
20
1993 1994 1995 1996 1997 1998 1999 2000 2001
Evolution of transboundary movements of waste
among Parties to the Basel Convention
Million
tonnes
Source: Basel Convention
NB: The Basel Conven-
tion does not cover
radioactive waste.