


 43 / 48

Landfilling
is the most common waste
management practice, and results in the
release of methane from the anaerobic de-
composition of organic materials. Methane
is around 20 times more potent as a GHG
than carbon dioxide. If the disposal of or-
ganic matter were decreased (for example
by composting or combustion) it would be
possible to reduce the amount of meth-
ane emissions. However, landfill methane
is also a source of energy, and some
landfills capture and use it for energy. In
addition, many materials in landfills do
not decompose fully, and the carbon that
remains is sequestered in the landfill and
not released into the atmosphere.
42
43
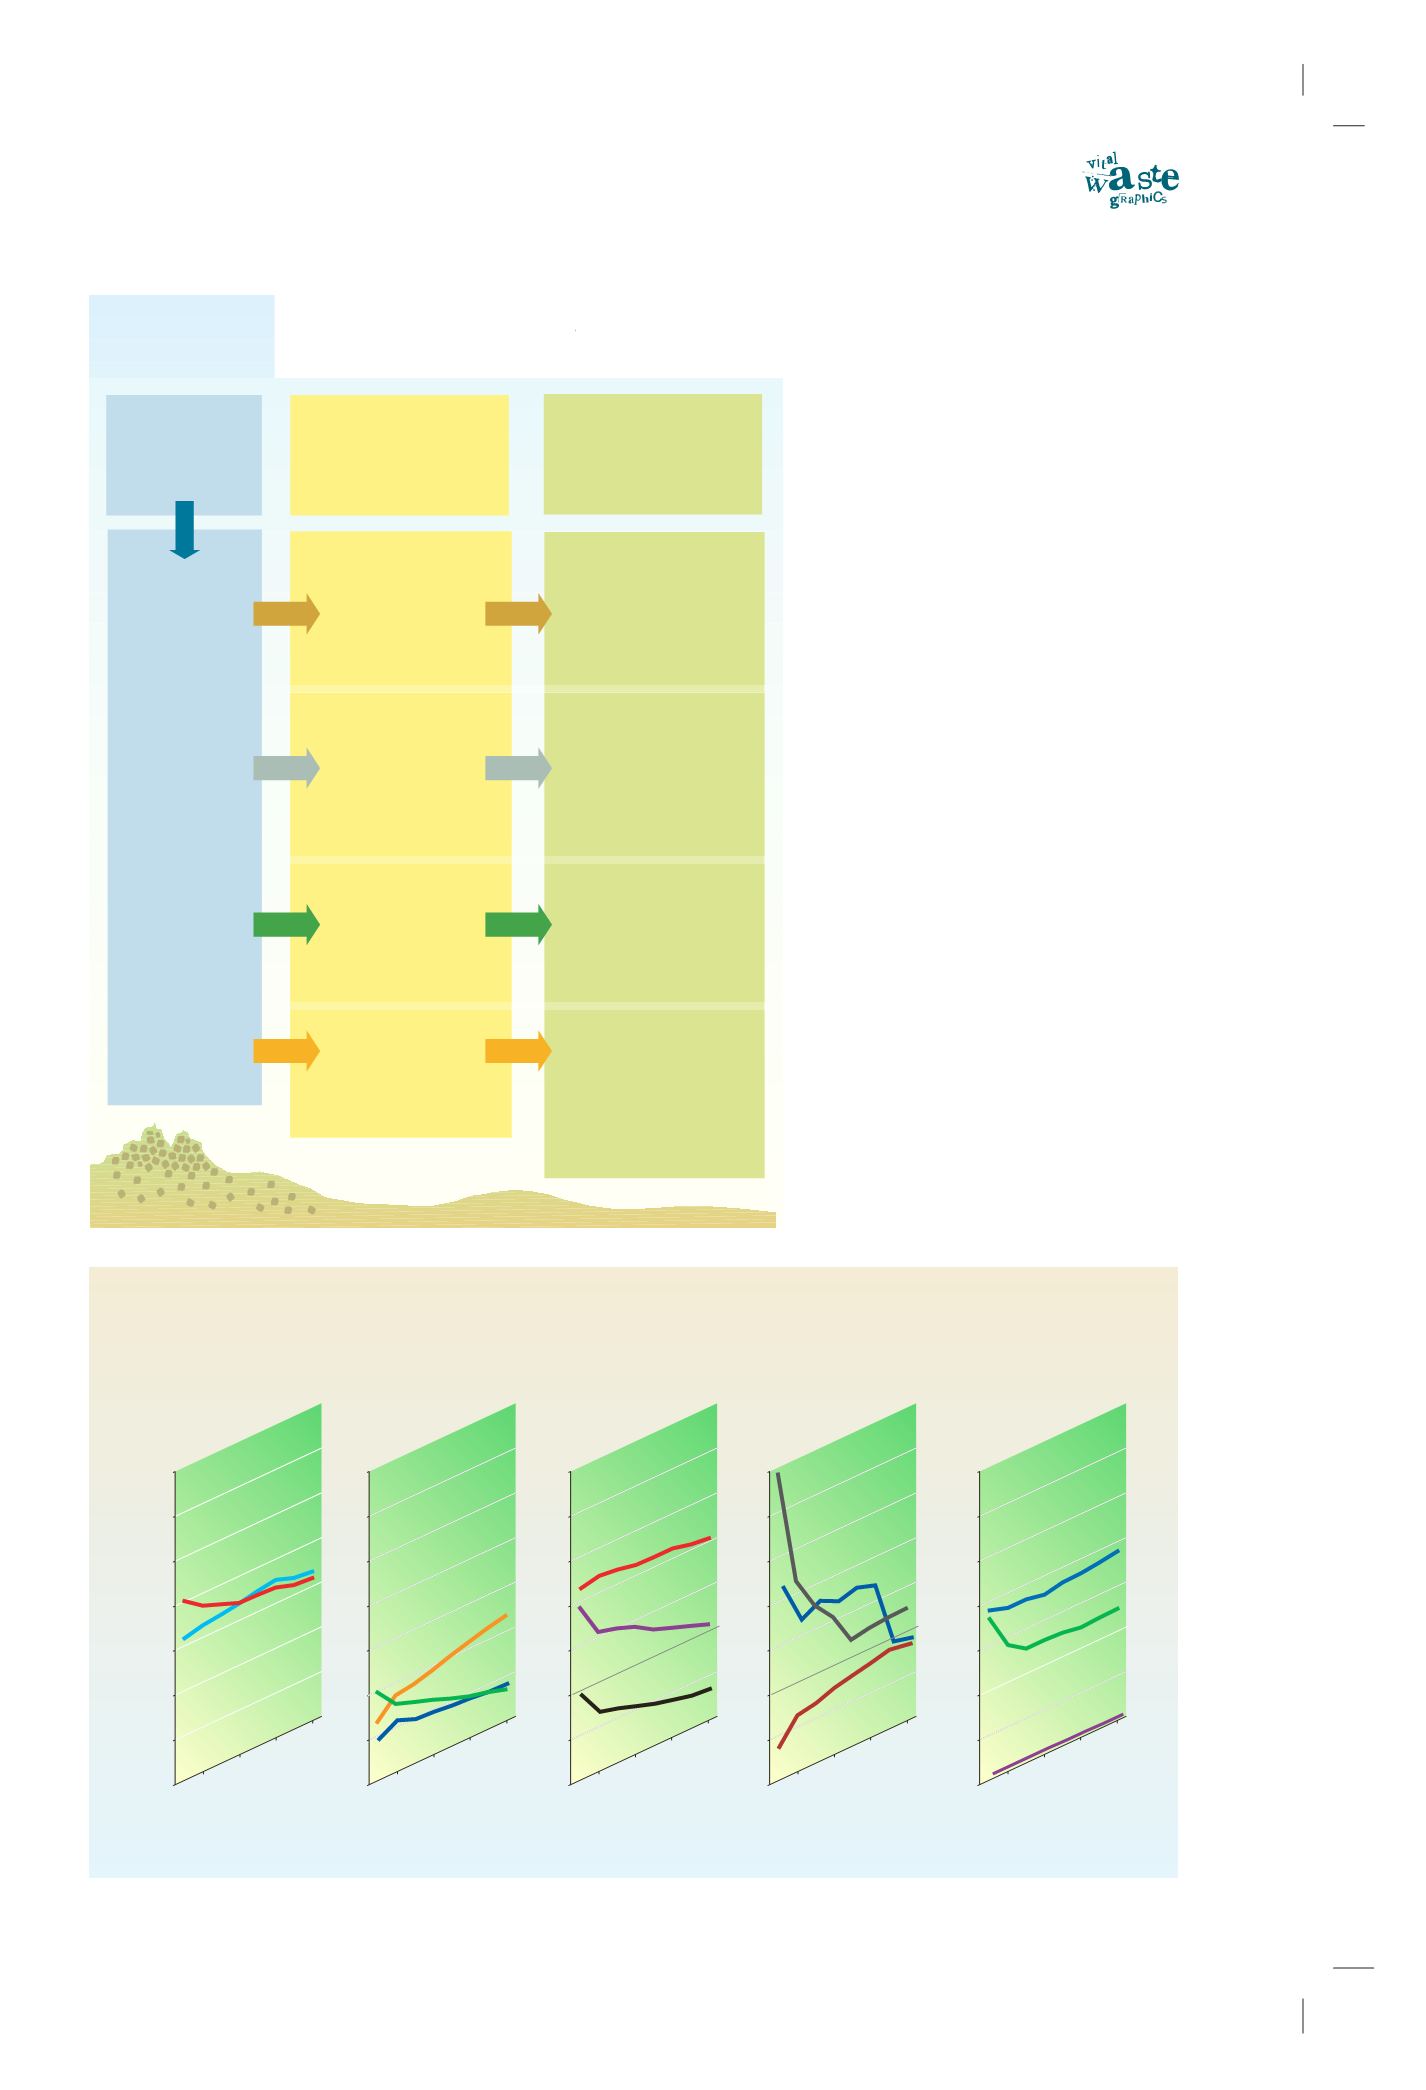
Life cycle
stage
Extraction
Manufacturing
Use
GHG emissions
contribution
to global warming
Sinks,
beneficial use
and solutions
Composting
CO
2
emissions
Incineration
CO
2
, N
2
O
aerosol particle
emissions
Landfilling
CH
4
and
methane precursor
emissions
- Carbon storage in the soil
- Reducing the amount
of organic fertilizer use
- Creating recycled
products
- Energy cogeneration
- Install filters
to reduce air pollution
- Ash recycled products
- Carbon storage in landfills
- Energy production
Waste management
- Avoided fossil fuel use
- Fewer impacts on the
climatic system due to
methane utilization
Contribution from waste to climate change
emissions
Recycling
- Reduced forest use and
increased carbon
sequestration
- Recovery of materials:
metals, glass, plastics
with fewer energy use
0
10
20
30
40
United States
Canada
50
60
70
Kg of methan per person
Kg of methan per person
Kg of methan per person
Kg of methan per person
Kg of methan per person
1996 1998 2000 2002
0
10
20
30
40
Greece
France
United Kingdom
50
60
70
1996 1998 2000 2002
0
10
20
30
40
The Netherlands
Norway
Germany
50
60
70
1996 1998 2000 2002
0
10
20
30
40
New Zealand
Australia
Japan
50
60
70
1996 1998 2000 2002
0
10
20
30
40
Estonia
Bulgaria
Latvia
50
60
70
1996 1998 2000 2002
Emissions due to solid waste disposal on land
Source: UNFCCC