


 40 / 140

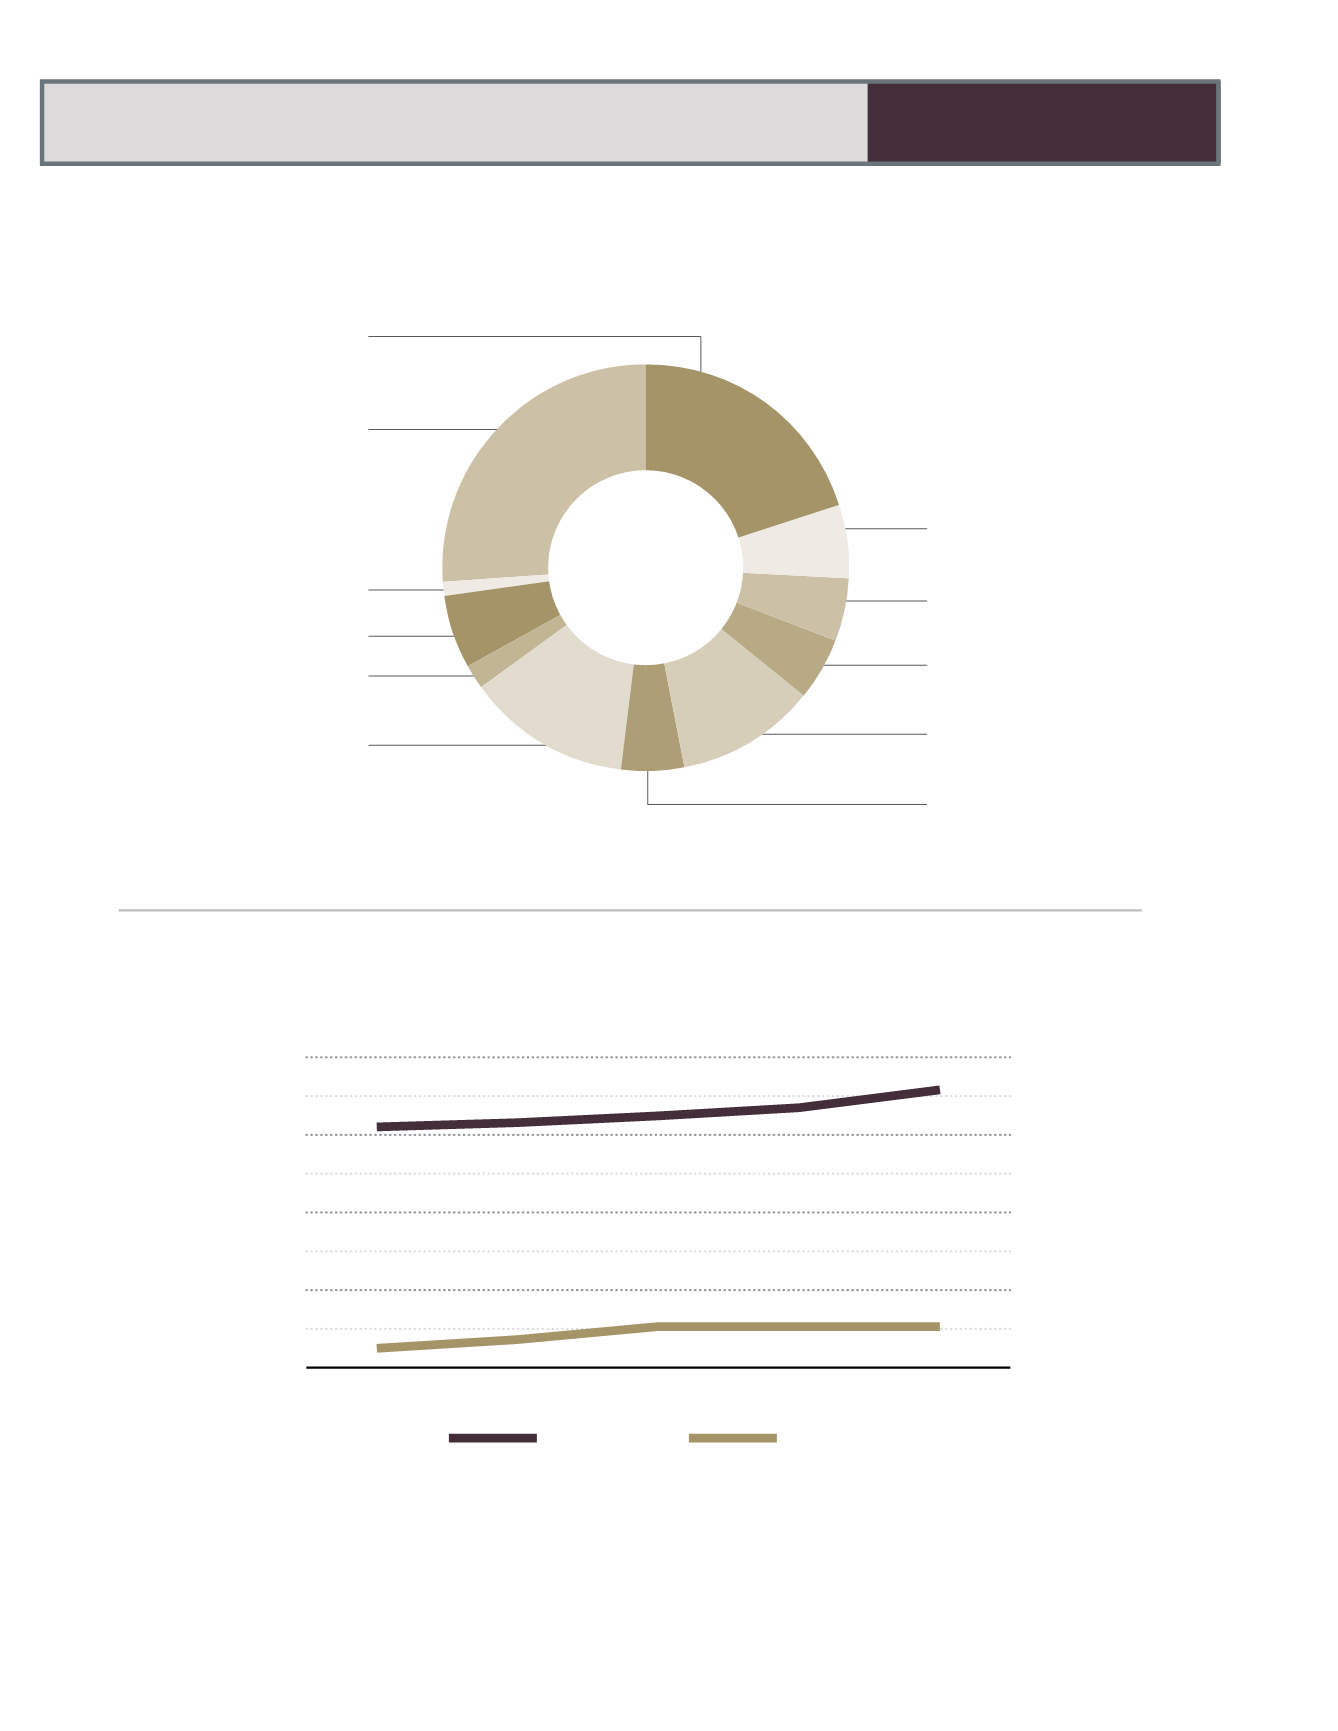
Surrey's Business Distribution by Sector
Source: City of Surrey Economic Development Division
Finance, Insurance &
Real Estate, 5%
Retail, 11%
Wholesale, 6%
Transportation, 5%
Manufacturing, 6%
Construction, 19%
Other Services, 26%
Cultural, 1%
Health, 6%
Education, 2%
Professional, Scientific &
Technical Services, 13%
Potential Borrowing Capacity versus Debt Incurred
(in millions)
Source: City of Surrey Financial Services Division
$0
$400
$800
$1,200
$1,600
2015
2014
2013
2012
2011
Borrowing Capacity
Debt Incurred
Overlapping debt which represents the total debt of regional districts where the City of Surrey is a member and is jointly and
severally liable, is not included. The City's overlapping debt (in millions of dollars) was $1,956 in 2015 (2014: $2,026).
30
STATISTICAL REVIEW