


 11 / 84

11
1
2
3
4
5
6
7
8
9
10
11
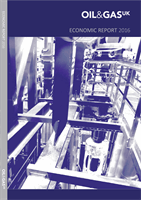
Figure 1: Monthly Oil and Gas Prices
0
20
40
60
80
100
120
140
2008 2009 2010 2011 2012 2013 2014 2015 2016
Nominal Price ($/boe)
Dated Brent
NBP Month Ahead
Source: Argus Media, ICIS Heren
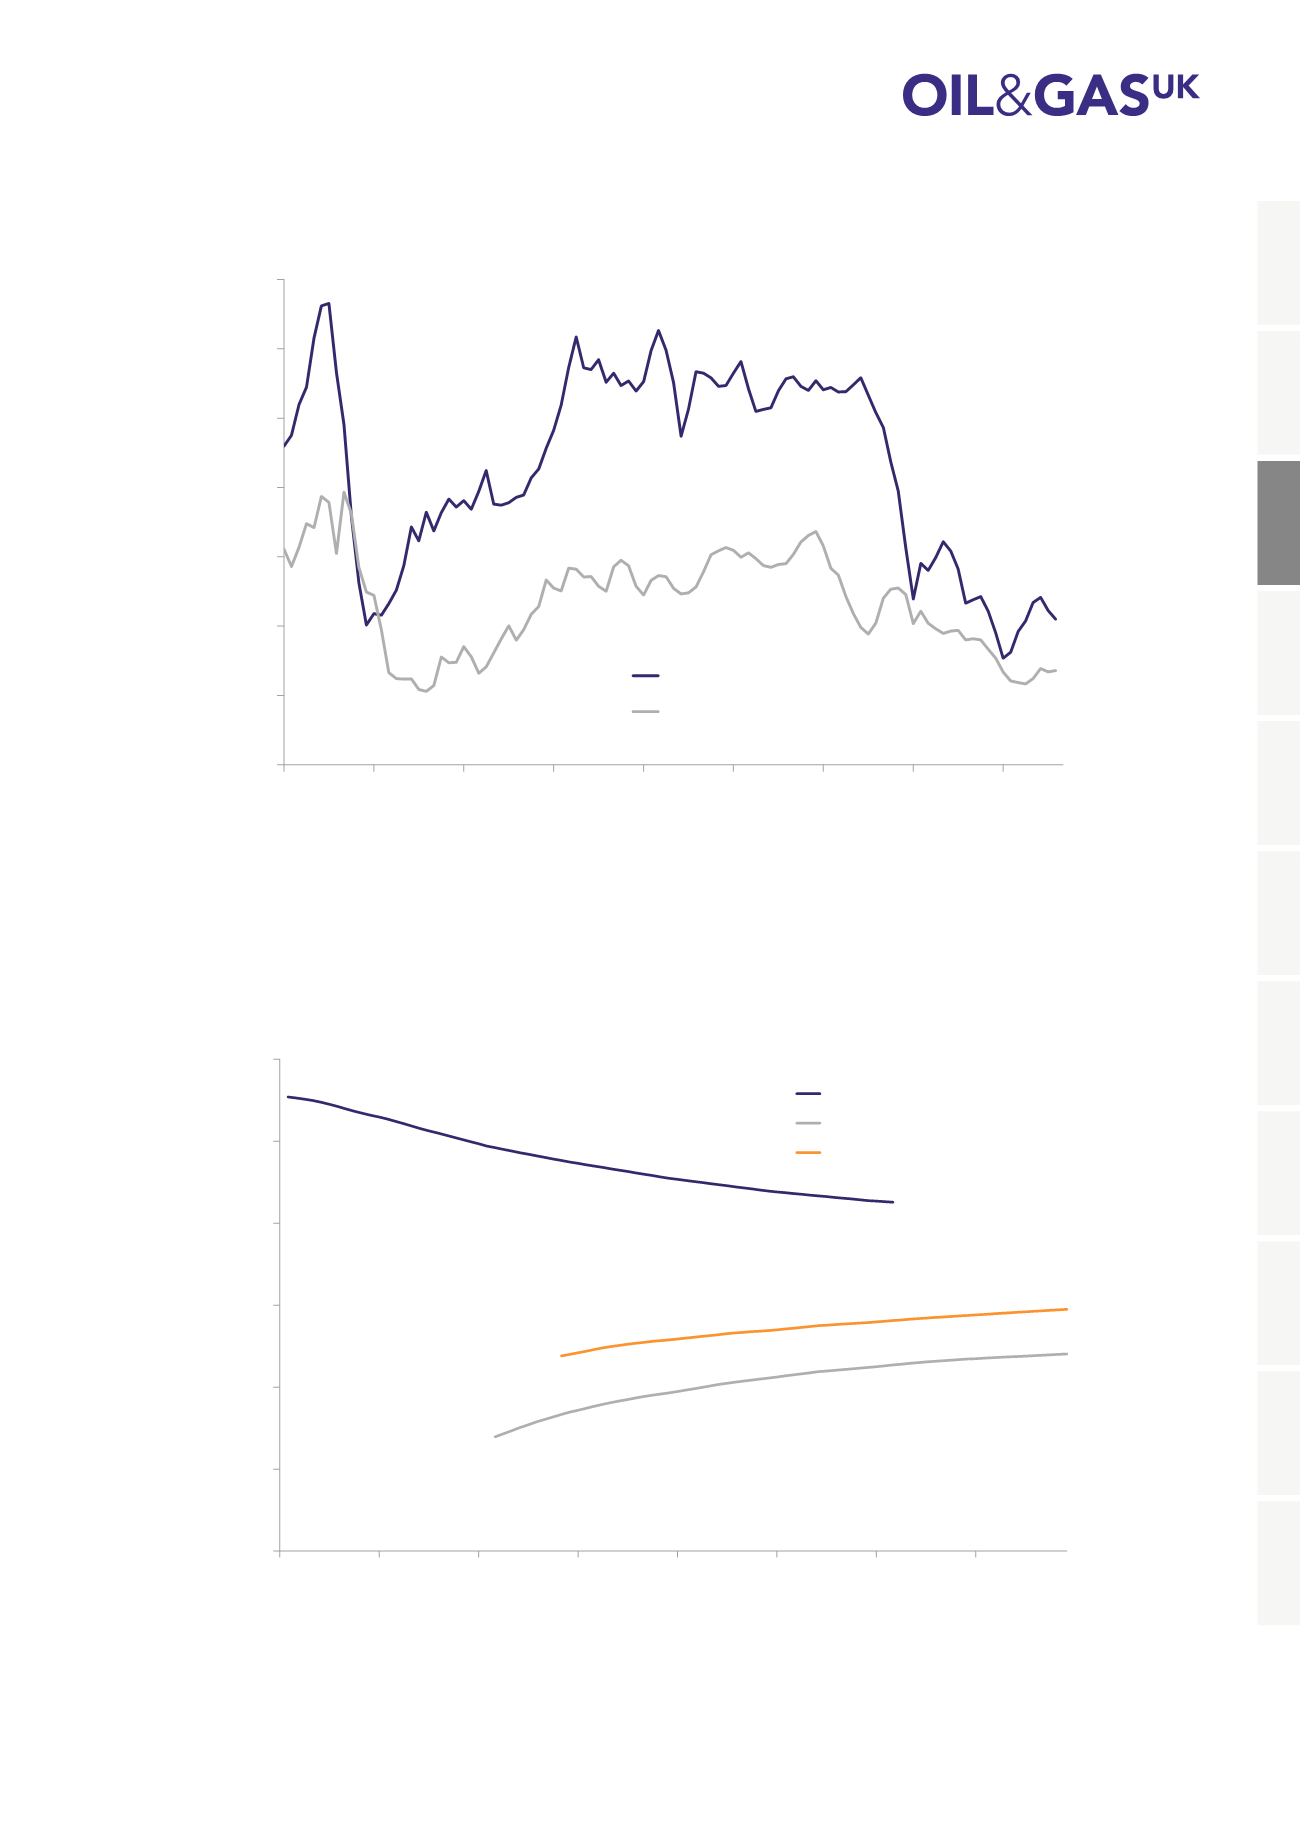
Figure 2: Brent Futures Curves
0
20
40
60
80
100
120
2014
2015
2016
2017
2018
2019
2020
2021
Brent Futures ($/bbl)
End 2013
20 January 2016 (market low)
September 2016 (current)
Source: Intercontinental Exchange