


 104 / 369

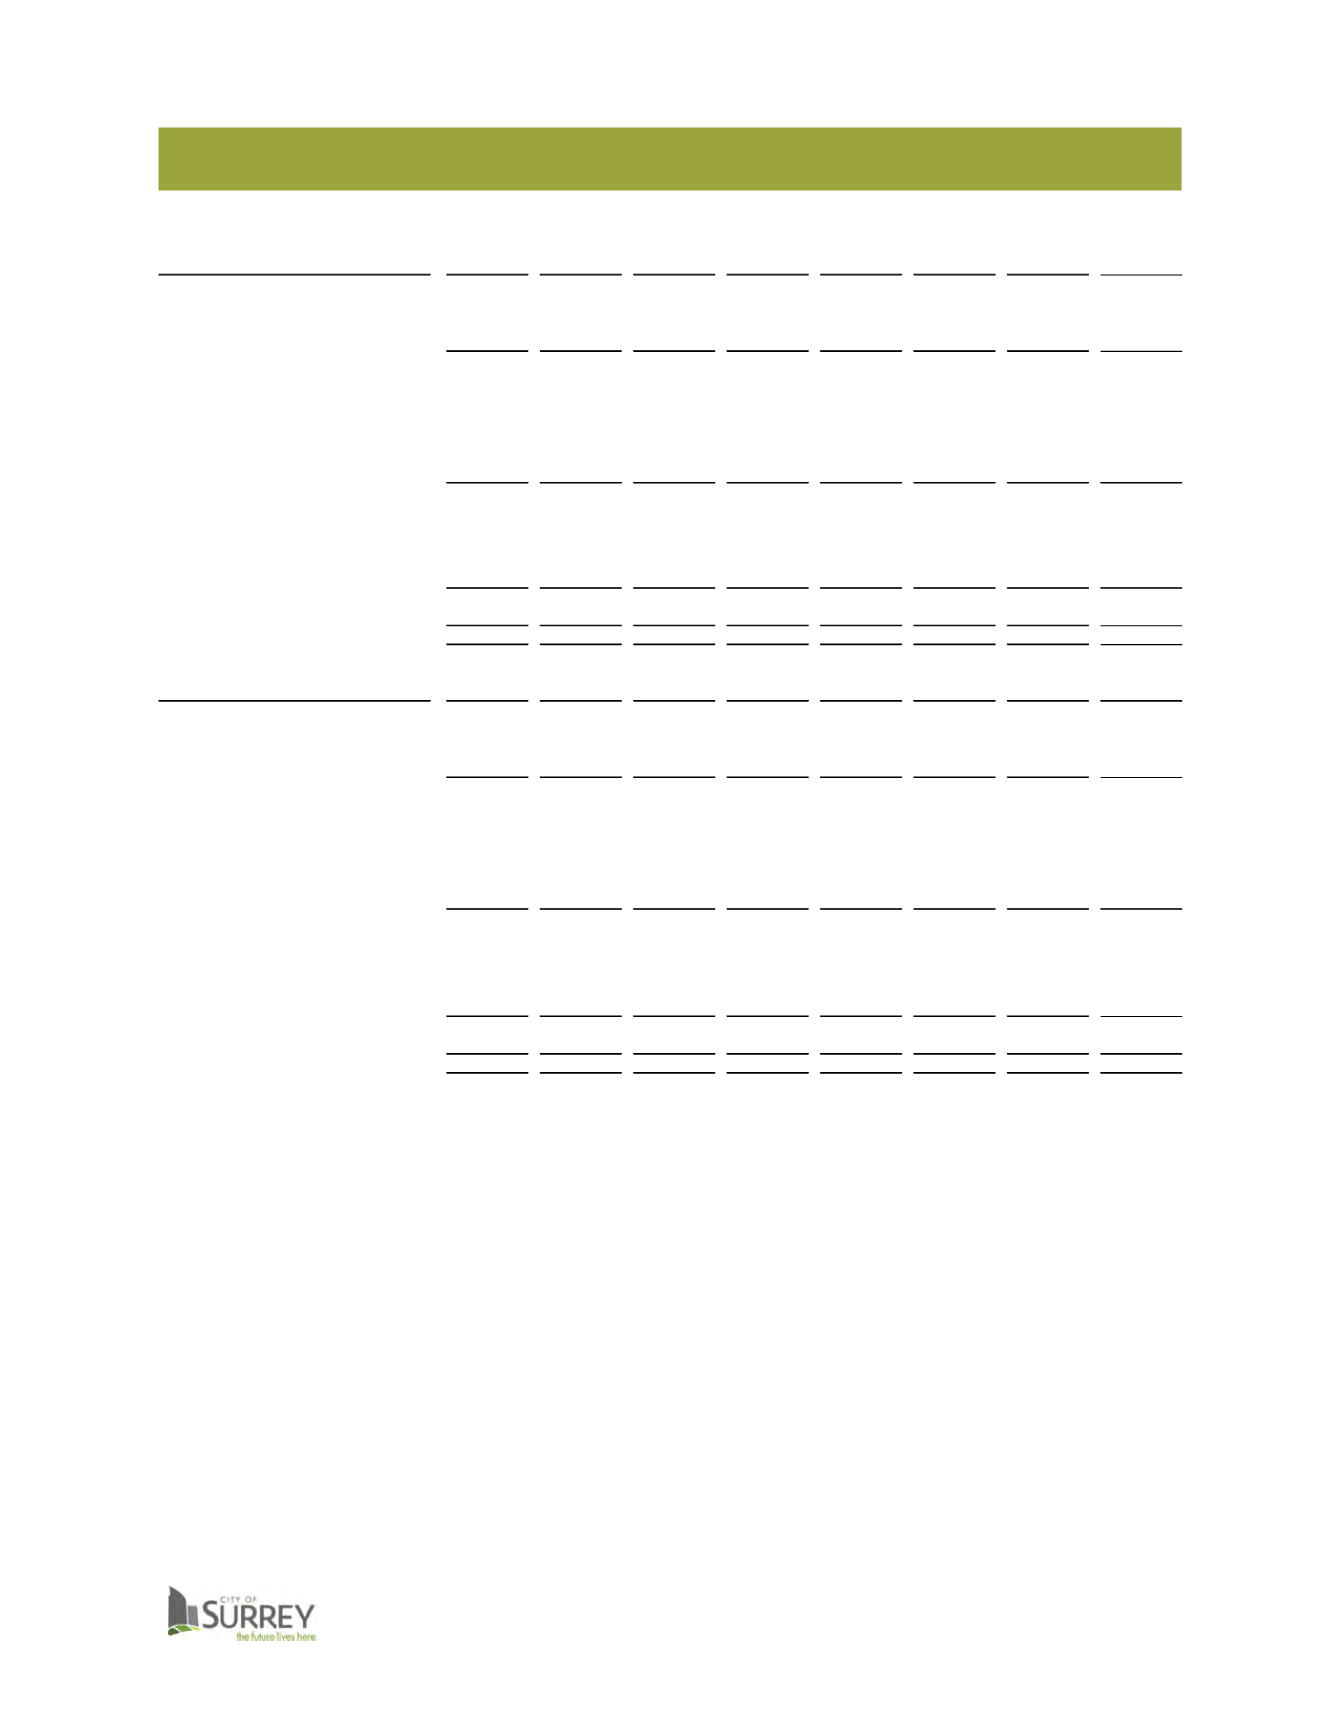
Mayor, Council & Grants—Departmental Operations
2016-2020 FINANCIAL PLAN
2014
2015
2015
2016
2017
2018
2019
2020
OFFICE OF THE MAYOR
ACTUAL ACTUAL BUDGET BUDGET
PLAN
PLAN
PLAN
PLAN
Revenues
Sales and Services
-
$
-
$
-
$
-
$
-
$
-
$
-
$
-
$
Grants, Donations and Other
-
-
-
-
-
-
-
-
-
-
-
-
-
-
-
-
Expenditures
Salaries and Benefits
570
771
600
607
615
623
653
685
Operating Costs
104
146
116
116
117
118
119
120
Internal Services Used
15
3
2
2
2
2
2
2
Internal Services Recovered
-
(6)
-
-
-
-
-
-
External Recoveries
(8)
(4)
-
-
-
-
-
-
681
910
718
725
734
743
774
807
Net Operations Total
681
910
718
725
734
743
774
807
Transfers
Transfer From Own Sources
-
(197)
-
-
-
-
-
-
Transfer To Own Sources
-
-
-
-
-
-
-
-
-
(197)
-
-
-
-
-
-
681
$
713
$
718
$
725
$
734
$
743
$
774
$
807
$
2014
2015
2015
2016
2017
2018
2019
2020
COUNCIL
ACTUAL ACTUAL BUDGET BUDGET
PLAN
PLAN
PLAN
PLAN
Revenues
Sales and Services
-
$
-
$
-
$
-
$
-
$
-
$
-
$
-
$
Grants, Donations and Other
-
-
-
-
-
-
-
-
-
-
-
-
-
-
-
-
Expenditures
Salaries and Benefits
520
591
542
541
542
543
555
567
Operating Costs
84
72
123
123
126
128
131
133
Internal Services Used
-
-
-
-
-
-
-
-
Internal Services Recovered
-
-
-
-
-
-
-
-
External Recoveries
(1)
(2)
-
-
-
-
-
-
603
661
665
664
668
671
686
700
Net Operations Total
603
661
665
664
668
671
686
700
Transfers
Transfer From Own Sources
-
-
-
-
-
-
-
-
Transfer To Own Sources
-
-
-
-
-
-
-
-
-
-
-
-
-
-
-
-
603
$
661
$
665
$
664
$
668
$
671
$
686
$
700
$
94