


 317 / 369

Surrey City Energy
2016-2020 FINANCIAL PLAN
PERFORMANCE MEASURES
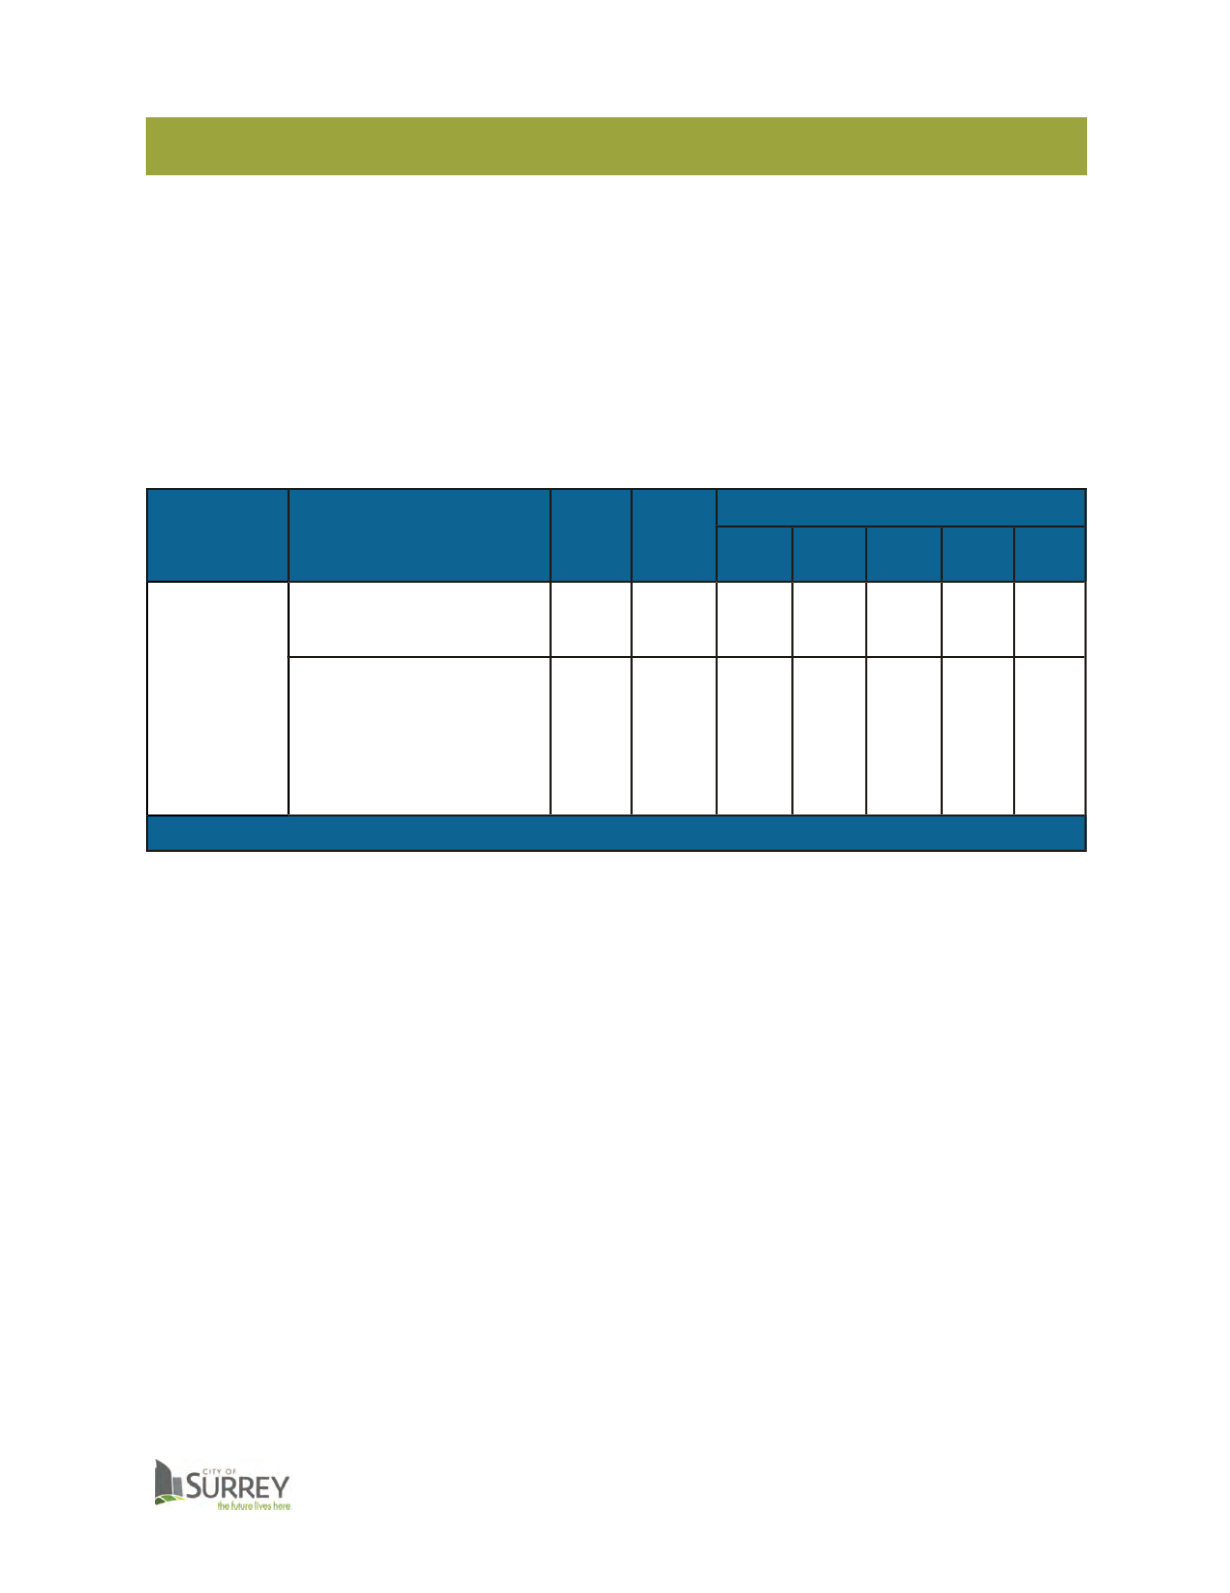
The following table identifies key performance measures that will assist the utility in
tracking its progress and monitoring its contribution to building a sustainable Surrey.
The performance measures chosen are strongly influenced by the state of the real estate
market as growth of the utility will occur in step with new high-density development.
District energy must be viewed as a long-term investment and it is difficult to evaluate
its performance over a 5 year time-frame. The table below includes the projected
performance of the City Centre District Energy System.
Division
Performance Measures
(Sustainability Pillar)
Actual
2015
Budget
2015
Budget
2016
2017
2018
2019 2020
Surrey City
Energy Utility
Connected Floor Area (m
2
)
(Economic)
37,625 37,625 110,000 195,000 315,000 395,000 540,000
Ratio of hours in service to
total hours since operating
commenced
(Socio-cultural)
100%
100%
100% 100% 100% 100% 100%
294