


 69 / 369

FINANCIAL OVERVIEW
SOURCE & APPLICATION OF FUNDS
2016-2020 FINANCIAL PLAN
35.5%
21.4%
15.0%
15.9%
2.0%
4.7%
5.5%
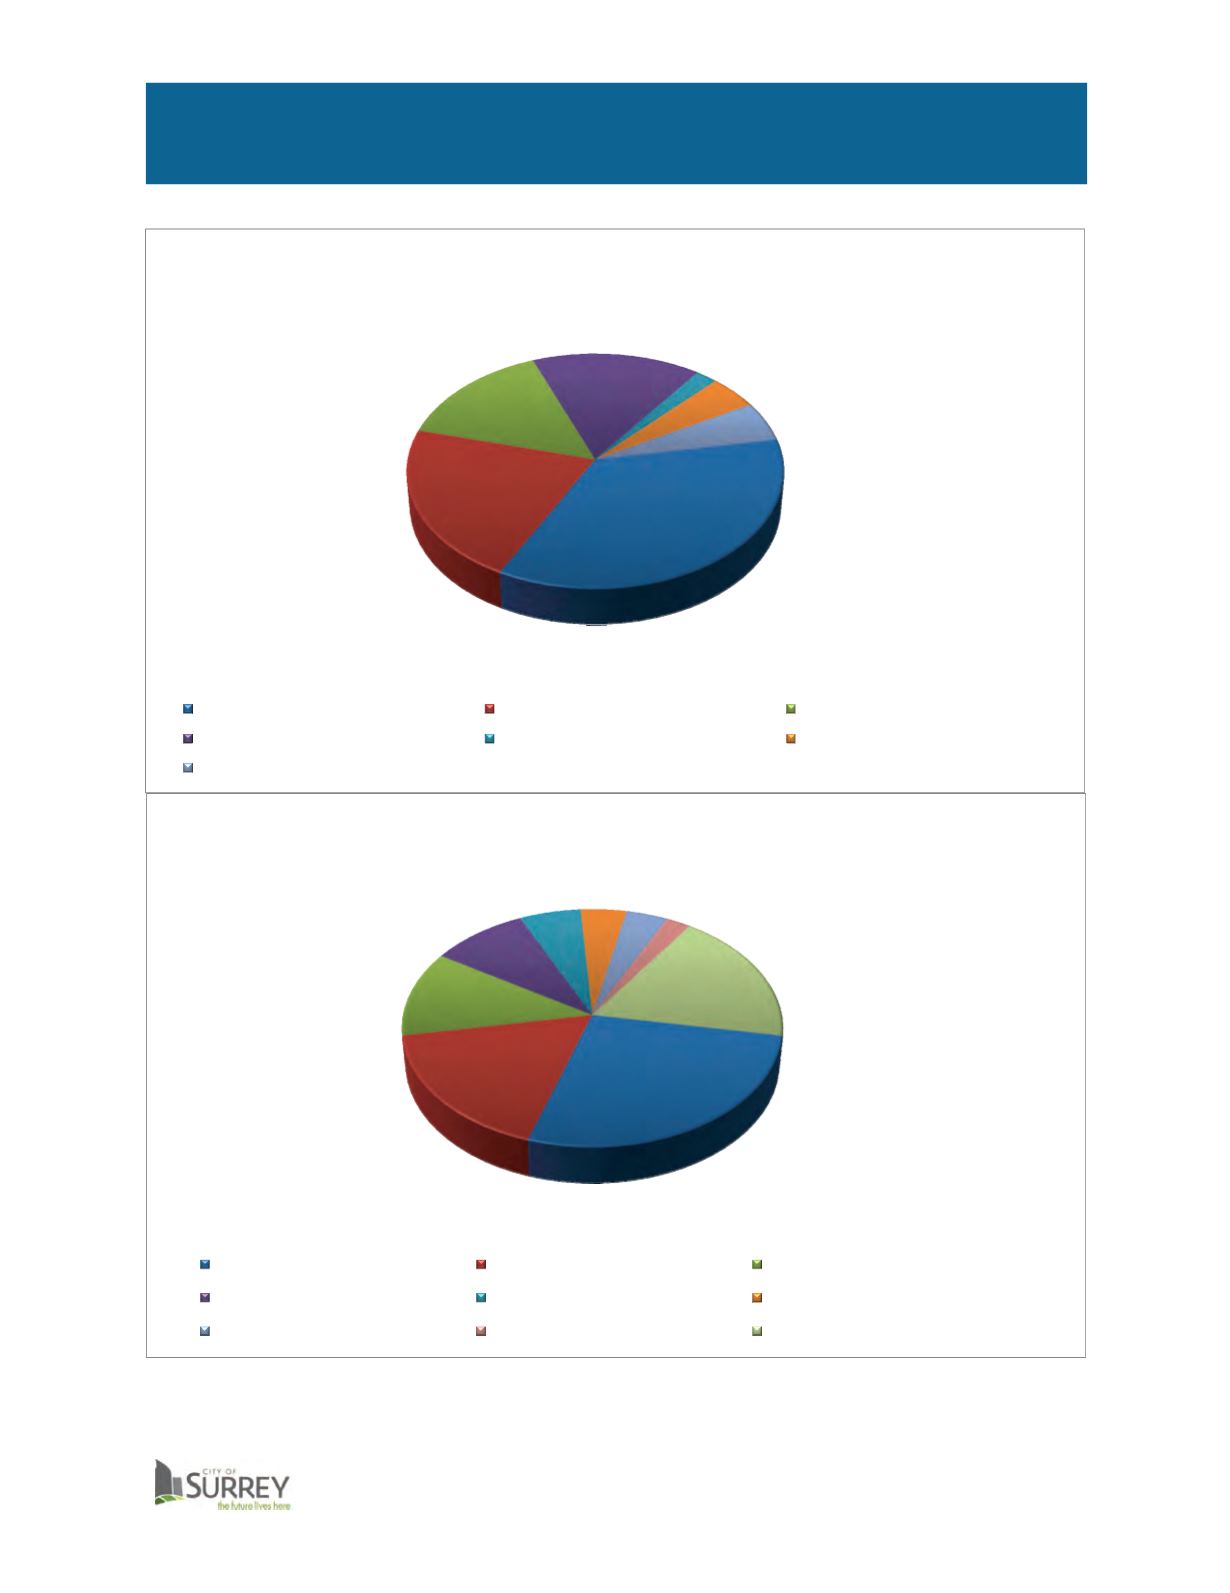
2015 Budget: Where the Money Comes From
Taxation for City Purposes 35.5%
Sales of goods and services 21.4%
Development cost charges 15.0%
Developer contributions 15.9%
Investment income 2.0%
Transfers from other government 4.7%
Other 5.5%
27.2%
17.3%
11.7%
9.2%
5.8% 4.3% 3.9%
2.3%
18.3%
2015 Budget: Where the Money Goes
Protection 27.2%
Water, sewer and drainage 17.3% Parks, Recreation and Culture 11.7%
General government 9.2%
Public works 5.8%
Solid Waste 4.3%
Planning and Development 3.9% Library services 2.3%
Amortization 18.3%
62