


 14-15 / 1676

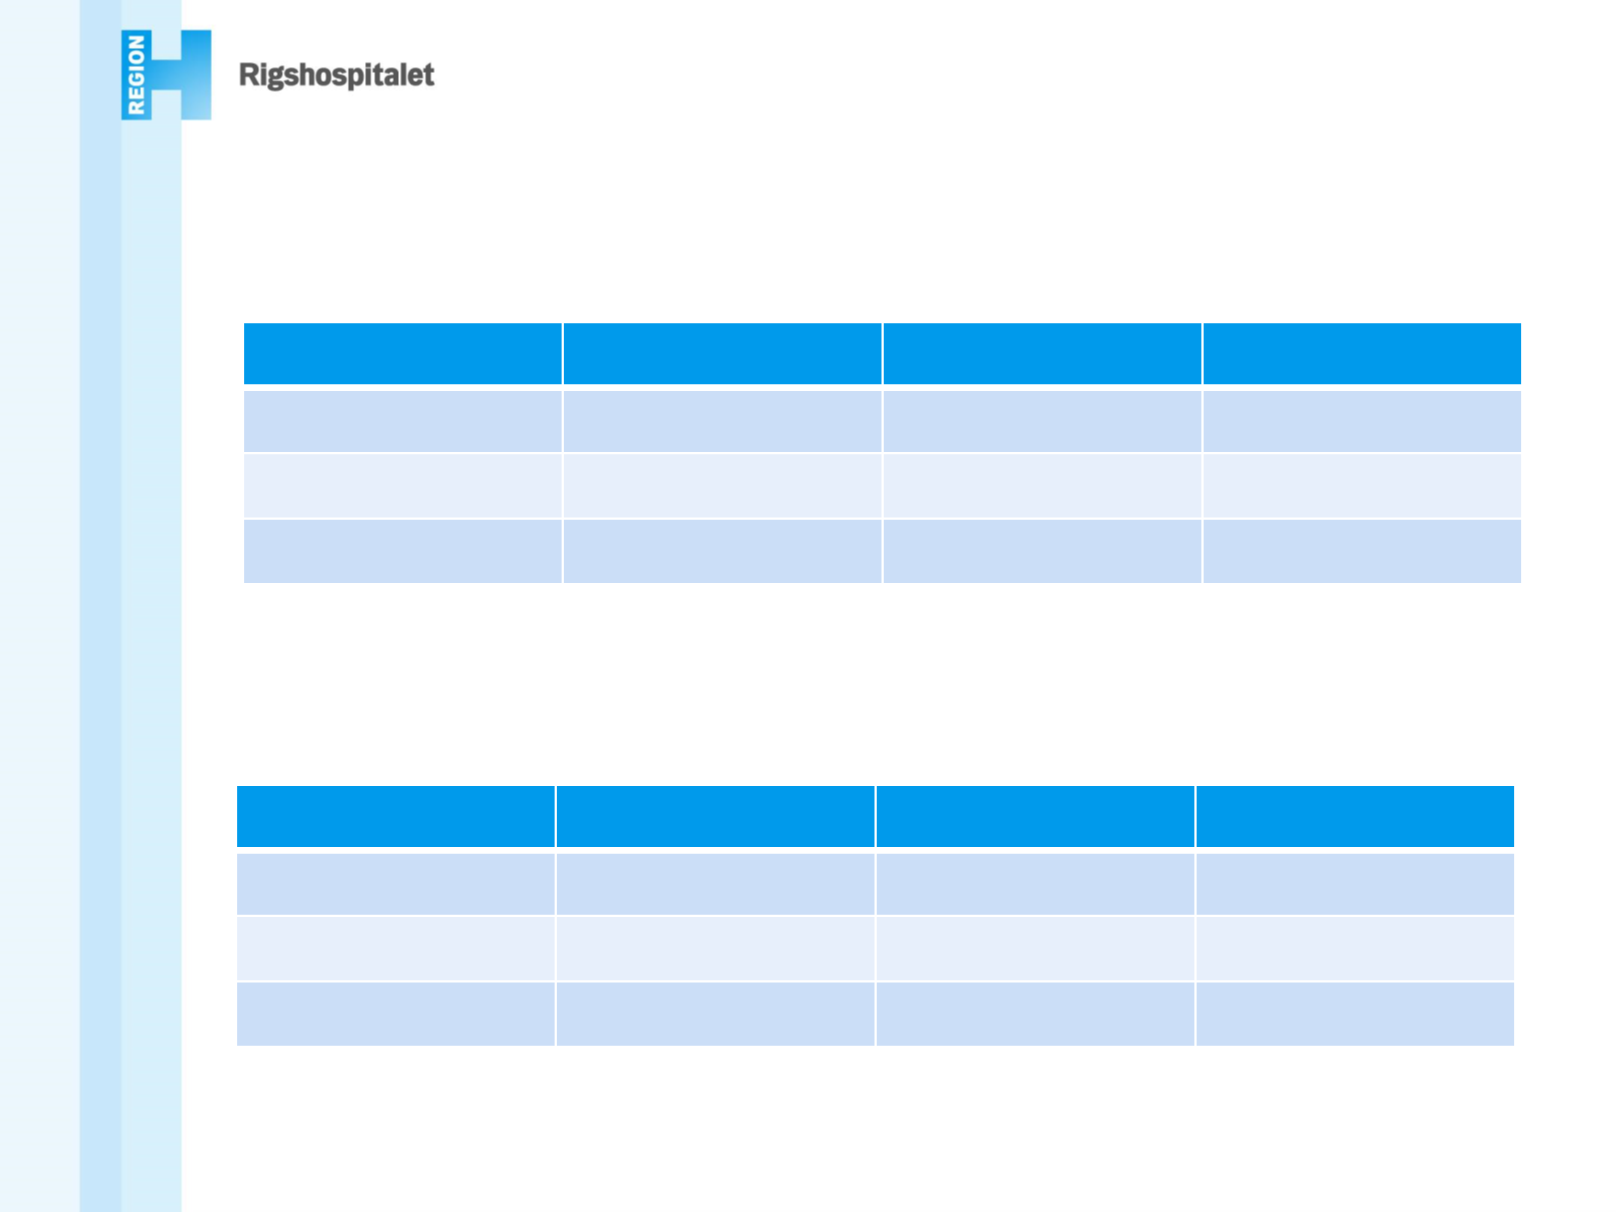
Example: Contingency tables
Observed
Toxicity
No Toxicity Total
Treatment A 30
70
100
Treatment B 40
60
100
Total
70
130
-
Expected
Toxicity
No Toxicity Total
Treatment A 35
65
100
Treatment B 35
65
100
Total
70
130
-
Assume null hypothesis: Equal toxicity