


 9 / 56

the detected pulse. This results in pulse width measurements that are
made on a single carrier cycle, and rise times of the carrier instead
of the modulated pulse. Detectors may be used on the input of the
oscilloscope to remove the carrier and overcome this.
A traditional Swept Spectrum Analyser is a simple RF detector
that is effectively swept across a selected span of RF frequencies.
This produces a display of the combined RF spectrum of all signals
within the selected span of frequencies. Measurements of carrier
frequency, pulse width and pulse duration can be made by manually
observing the lines within the spectrum display, aided by on-screen
marker readouts. The carrier is at the centre of the pulse spectra that
are shown in
Figure 4
. The carrier is marked there with the letter ‘A.’
The spectrum analyser does particularly well at displaying the
spectrum of a pulse-modulated RF carrier, provided that the signal
is repetitive, stable, and the Resolution Bandwidth (RBW) and Video
Bandwidth (VBW) controls are correctly set. Spectrum analysers are
usually optimised for the high dynamic range needed to see very small
signals in the presence of very large ones. Fast Fourier Transform or
FFT-based Vector Signal Analysers (VSA) use internal digitisers to
sample an acquisition bandwidth at a fixed frequency may have as
much as 75 to 85 dB SFDR (Spurious-Free Dynamic Range).
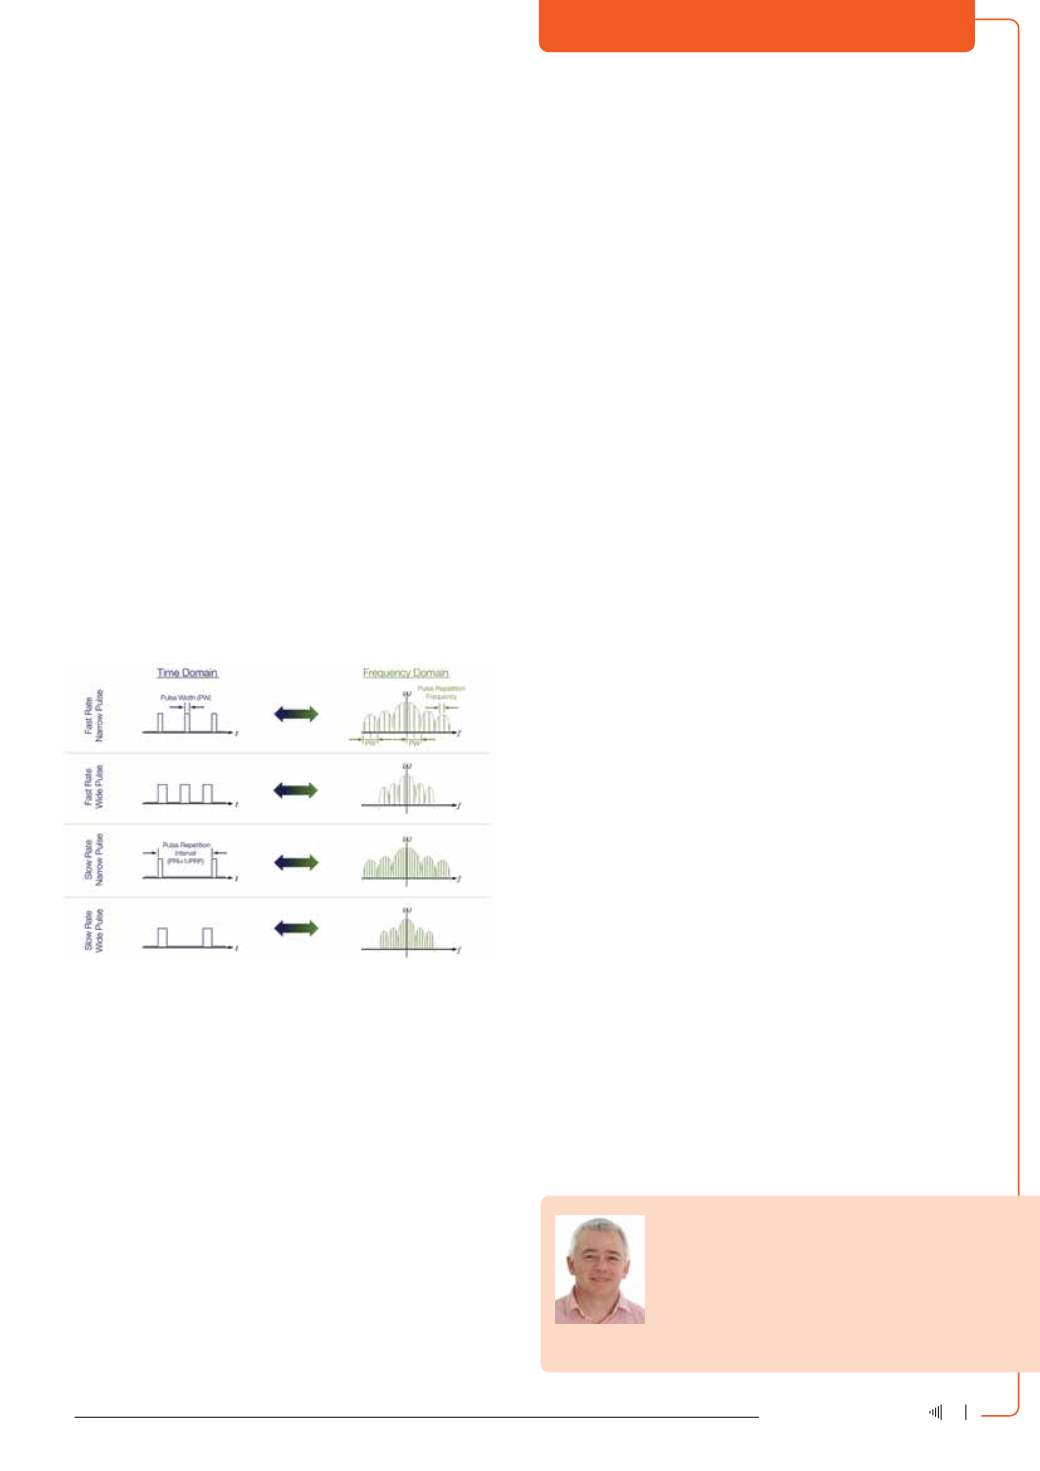
Figure 4: Spectrum plot measurements of pulse width and repetition rate.
Because of the inverse relationship between frequency and time,
it is possible to determine basic pulse timing parameters using the
spectrum analyser frequency domain display. The pulse repetition
time (pulse period) is the inverse of the frequency spacing between
the finely-spaced lines within the larger spectrum envelope. The pulse
width is the inverse of the frequency spacing between the nulls in
the spectrum envelope.
Using a swept spectrum analyser, there can be an alias between
the sweep time and the pulse rate. The analyser will provide a verti-
cal deflection only at the exact time the pulse is ON, and produce no
deflection during the pulse off-time. This may appear to be the Pulse
Repetition Frequency (PRF) lines, but the apparent frequency spacing
will change as the sweep rate of the analyser is varied. This manual
change of sweep time is necessary to determine if the lines seen are
PRF or are the sweep-time alias. FFT-based VSA analysers do not
exhibit this alias. Swept spectrum analysers also have a zero-span
mode where the operator selects an RF frequency, and the instru-
ANALYTICAL INSTRUMENTATION
Dean Miles is a senior technical marketing manager at
Tektronix responsible for Tektronix High Performance Product
Portfolio. Dean has held various positions at Tektronix during
his more than 20 years with the company, including global
business development manager for Tektronix RF Technolo-
gies and business development manager for Tektronix Opti-
cal Business Unit. Enquiries: Comtest on 010 595 1821 or
sales@comtest.co.zament is stopped at this frequency without sweeping its frequency
converter. The detector is now responding to all signals within the
IF bandwidth (otherwise known as Resolution Bandwidth – RBW) of
the analyser. The pulse is displayed versus time on the instrument
display. The result is a display of RF power versus time just like an
oscilloscope, but with the increased dynamic range of the spectrum
analyser available.
In the zero-span mode, RF pulses are detected and shown as
baseband pulses. The rise time capability of the zero-span mode is
limited by the widest resolution filter available in the analyser's IF
system. In the case of either a VSA or a Real-time Spectrum Analyser
(RSA) which can digitise and store a wide frequency band in one
capture, signal amplitude-versus-time can be displayed.
This can show pulse rise time as fast as the full capture band-
width allows, and the spectrum display does not have the lines. For
rise times faster than this bandwidth will support, an oscilloscope
is recommended for accurately measuring rise times of the pulses.
Conclusion
There are RF spectrummeasurements that can bemademanually with
markers on a spectrumdisplay, but are commonly found as automated
routines in most instruments since these can be quite tedious if done
manually. The basic software of the RSA5000 and RSA6000 Series,
or an oscilloscope with the SignalVu vector signal analysis software,
includesmany commonly automatedmeasurements such as Occupied
Bandwidth (OBW), Complementary Cumulative Distribution Function
(CCDF) and Adjacent Channel Power Ratio (ACPR) (also known as
Spectral Re-growth). Occupied Bandwidth is the most relevant for
pulsed radar. Most radars have tomeet a specified bandwidth to avoid
interfering with RF systems operating on nearby frequencies. This
measurement examines the RF spectrum of the signal and locates the
highest amplitude value. Then an integration of the power across the
spectrum is performed to find the bandwidth occupied by the specified
percent of the total power. The default setting reports the 99% power
bandwidth, but the user can enter other values.
The Real-time Spectrum Analyser (RSA) has an RF conversion
section similar to a swept spectrum analyser. The RSA5000 Series
digitises up to a 110 MHz bandwidth with up to 78 dB of spurious-
free dynamic range. The digitised samples are directly processed
by hardware DSP, and can be simultaneously saved in memory
or on a hard disk. This hardware processor performs discrete time
transforms into RF spectrum information. This provides real-time
triggering on selected frequency events, or a DPX Live RF spectrum
display that can discover RF transients and display same-frequency
time-sharing RF signals.
7
October ‘15
Electricity+Control