


 406-407 / 499


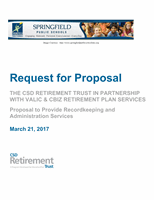
CSD Retirement Trust 403(b) Plan
VALIC Fixed Interest Option - VFIOP
Monitoring Rating: Pass
Objective
Insufficient Data
Statistics
Inception Date
-
Manager Tenure
-
Assets($1000s)
-
Net Exp Ratio
-
12b-1 Fees
-
Average Mkt Cap($1000s)
-
Risk Characteristics
VFIOP Cat Avg
3 Yr Std Dev
-
0.06
5 Yr Std Dev
-
0.08
5 Yr Beta
-
1.03
5 Yr Alpha
-
-0.06
5 Yr Sharpe
-
15.01
5 Yr Information Ratio
-
-0.98
5 Yr Tracking Error
-
0.06
5 Yr Upside Capture
-
97.66
5 Yr Downside Capture
-
-
5 Yr Batting Avg
-
0.46
Excess Returns vs. Category/Index
vs ML U.S. Treasury STRIPS 3 Year
vs Category Avg
2
1
0
-1
10-Yr
5-Yr
3-Yr
12-Month
3-Month
-0.31
1.33
0.8
0.69
1.72
0.66
0.95
0.88
0.74
0.16
Calendar Year Performance
2012
2013
2014
2015
2016
VFIOP
-
-
-
-
-
Cat Avg
1.64
1.22
1.15
1.28
1.35
Index
0.96
-0.23
1.42
1.24
1.40
Cat Rank
-
-
-
-
-
Fixed Income Style
Quality
Duration
Maturity
Yield
VFIOP
-
-
-
0.00
Cat Avg
A
2.65
4.05
1.39
Sector Allocation vs. Category
0
-20
-40
Government
Municipal
Corporate
Securitized
Cash&Equivalents
Derivatives
-13.93
-0.07
-30.2
-6.72
-17.7
-0.02
+/-Category Avg
Asset Allocation
Other (0.00%)
Non-US Bonds (0.00%)
US Bonds (0.00%)
Non-US Stocks (0.00%)
US Stocks (0.00%)
Cash (100.00%)