


 412-413 / 499


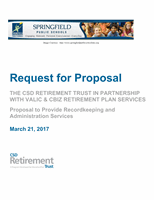
CSD Retirement Trust 403(b) Plan
Vanguard Total Bond Market Index Adm - VBTLX
Monitoring Rating: Pass
Objective
The investment seeks the performance of a broad, market-
weighted bond index. The fund employs an indexing
investment approach designed to track the performance of
the Bloomberg Barclays U.S. Aggregate Float Adjusted Index.
This index represents a wide spectrum of public, investment-
grade, taxable, fixed income securities in the United States-
including government, corporate, and international dollar-
denominated bonds, as well as mortgage-backed and asset-
backed securities-all with maturities of more than 1 year. All of
its investments will be selected through the sampling process,
and at least 80% of its assets will be invested in bonds held in
the index.
Statistics
Inception Date
11/12/2001
Manager Tenure
3.92
Assets($1000s)
$171,815,195
Net Exp Ratio
0.06
12b-1 Fees
-
Average Mkt Cap($1000s)
-
Risk Characteristics
VBTLX Cat Avg
3 Yr Std Dev
3.23 2.94
5 Yr Std Dev
3.05 2.97
5 Yr Beta
1.05 0.93
5 Yr Alpha
-0.18 0.52
5 Yr Sharpe
0.67 0.85
5 Yr Information Ratio
-0.33 0.13
5 Yr Tracking Error
0.28 1.17
5 Yr Upside Capture
102.69 101.26
5 Yr Downside Capture
107.98 89.04
5 Yr Batting Avg
0.52 0.53
Excess Returns vs. Category/Index
vs BBgBarc US Agg Bond TR USD
vs Category Avg
0.5
0
-0.5
-1
10-Yr
5-Yr
3-Yr
12-Month
3-Month
-0.05
-0.09
-0.09
-0.05
-0.19
0.19
-0.48
0.2
-0.63
-0.63
Calendar Year Performance
2012
2013
2014
2015
2016
VBTLX
4.15
-2.15
5.89
0.40
2.60
Cat Avg
6.65
-1.41
5.34
-0.21
3.23
Index
4.21
-2.02
5.97
0.55
2.65
Cat Rank
84
69
32
30
64
Fixed Income Style
Quality
Duration
Maturity
Yield
VBTLX
AA
5.94
8.20
2.65
Cat Avg
BelowB
5.08
7.55
2.90
Sector Allocation vs. Category
20
0
-20
Government
Municipal
Corporate
Securitized
Cash&Equivalents
Derivatives
17.68
-0.77
-5.18
-14.11
2.79
1.4
+/-Category Avg
Asset Allocation
Other (0.04%)
Non-US Bonds (9.52%)
US Bonds (86.68%)
Non-US Stocks (0.00%)
US Stocks (0.00%)
Cash (3.76%)